
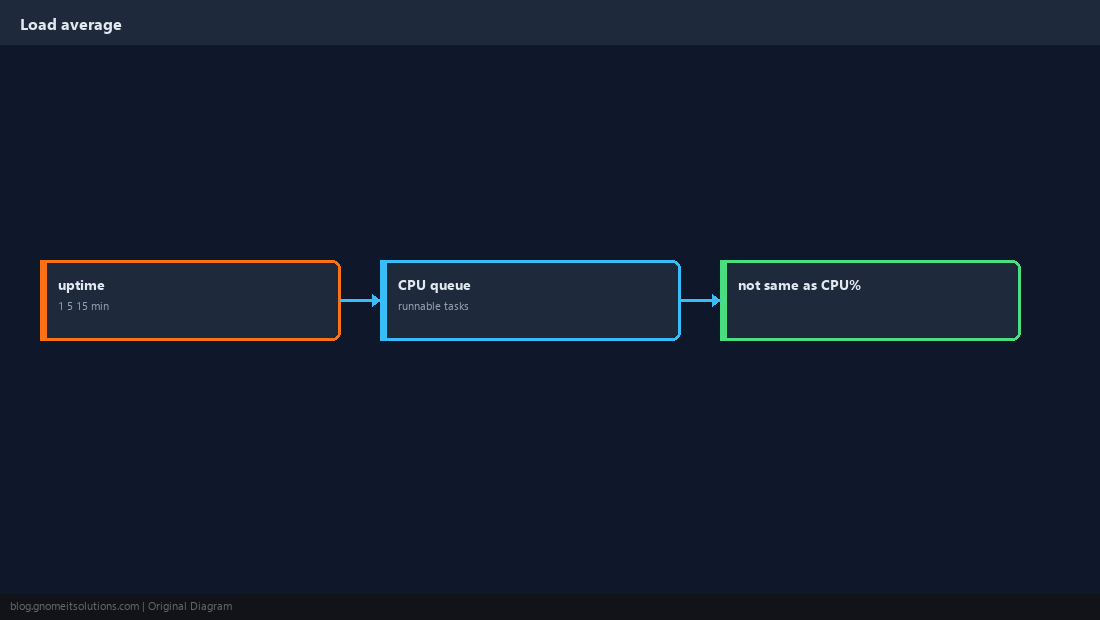
Load average confuses newcomers because it is not a CPU percentage. It estimates how many tasks are runnable or waiting (including on disk), smoothed over 1, 5, and 15 minutes — the numbers uptime prints after the time.
Tools: htop guide,
top, iostat, vmstat.
What the Three Numbers Mean
They are exponentially damped moving averages of runnable + uninterruptible tasks.
uptime Quick Check
First command on a slow SSH session.
uptime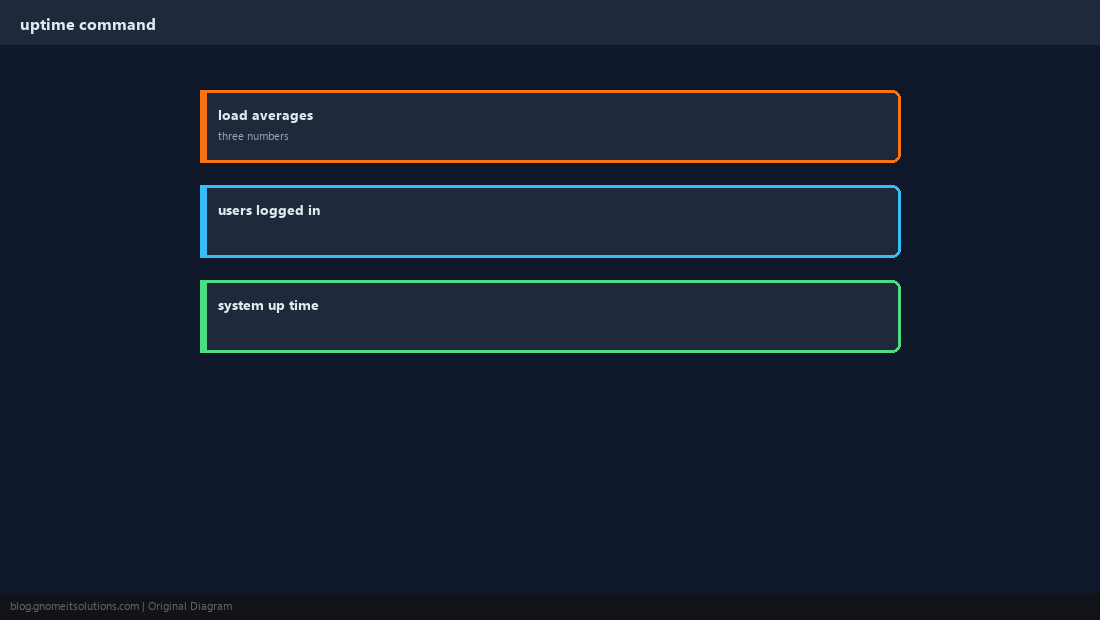
Compare With top or htop
See whether CPUs are busy, idle, or waiting on disk.
nproc
htop   # or: top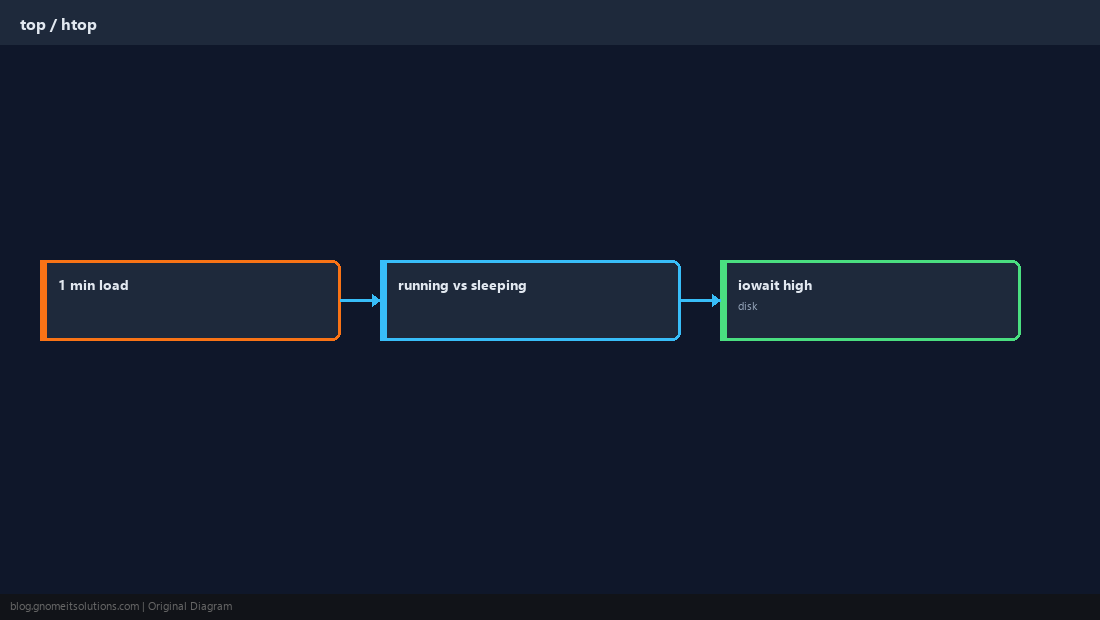
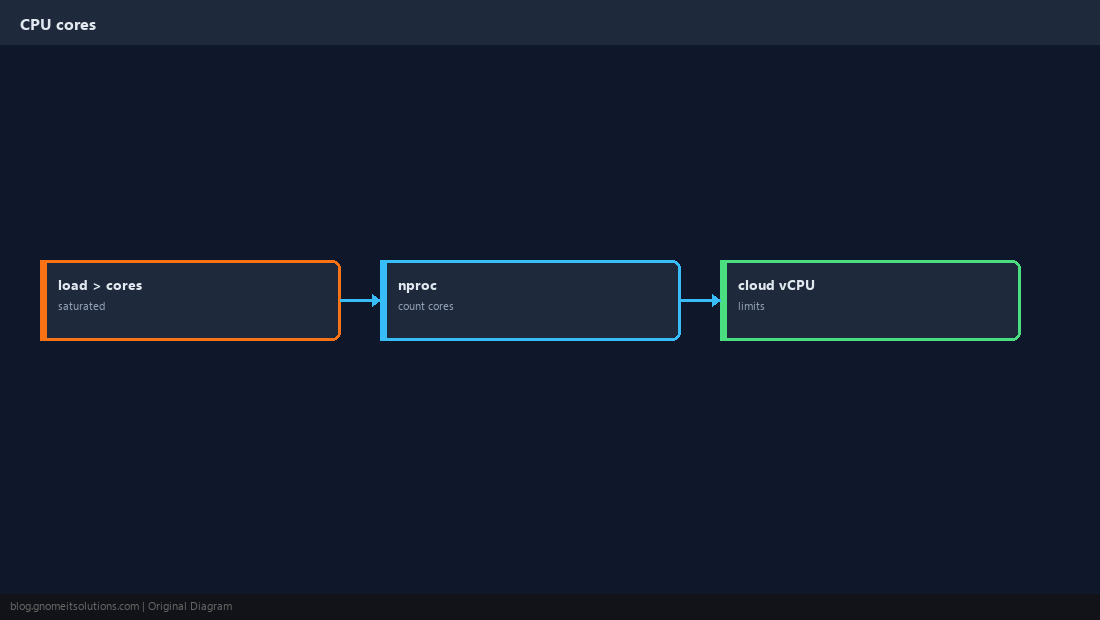
Rule of Thumb: Cores
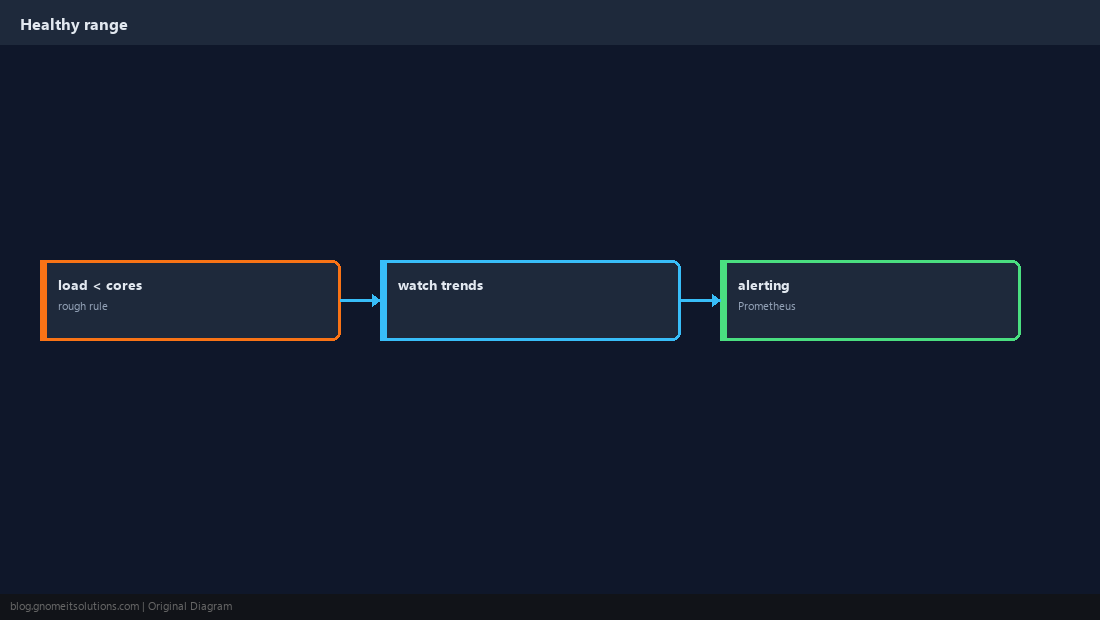
On a 4-vCPU VM, sustained load above ~4 often means saturation; context matters for I/O-heavy workloads.
High Load, Low CPU: iowait
Disk or NFS bottlenecks inflate load while CPU looks idle — check wa in vmstat.
vmstat 1 5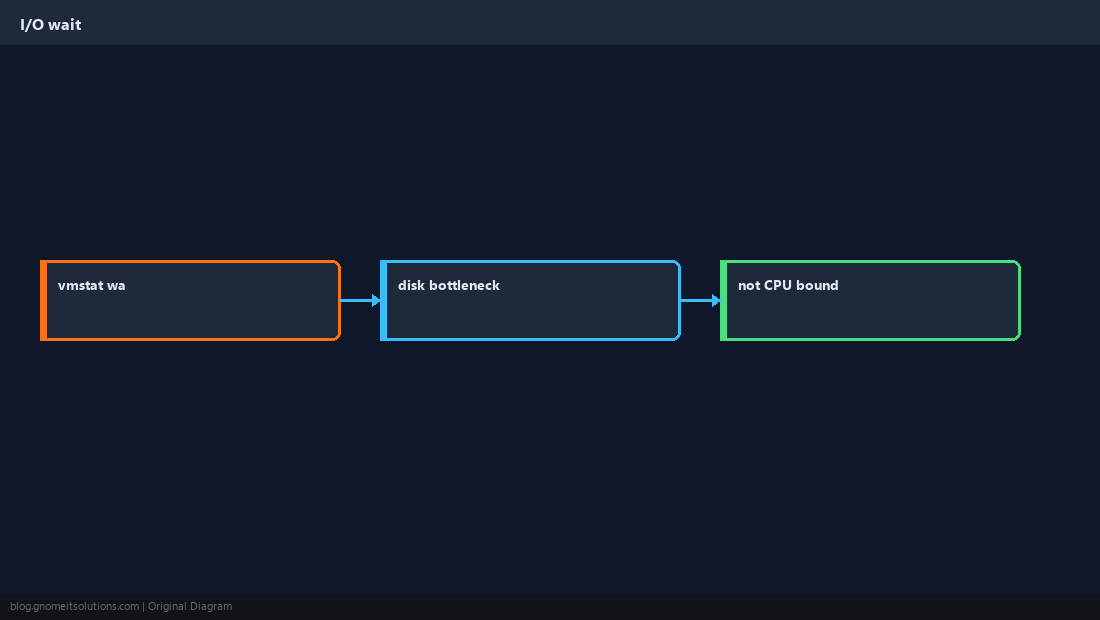
What to Do Next
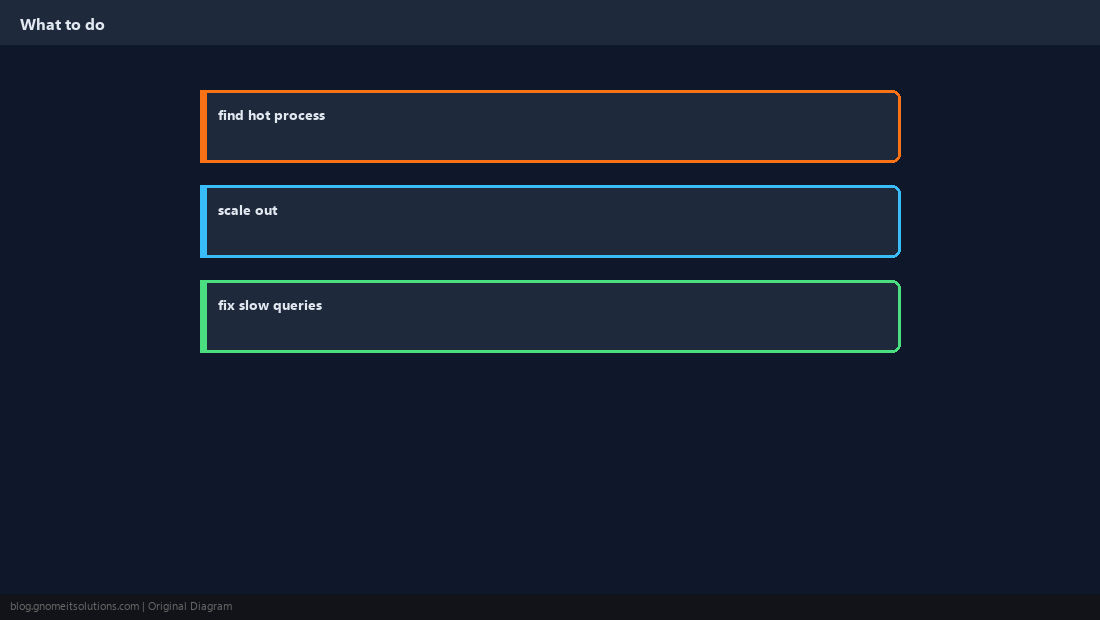
Find the hot process, fix queries, add RAM/disk throughput, or scale horizontally.
Monitoring
Alert on trends, not a single spike during apt upgrade.
Quick Reference
uptime→ compare load tonproc- High load + high
wa→ disk I/O - Use htop to find the process
Related tutorials
Diagrams are original illustrations by Gnome IT Solutions. Tutorial text © Gnome IT Solutions.