
Our Prometheus + Grafana guide gives you metrics — CPU, memory, disk trends over time. It doesn’t give you the actual log lines when something breaks. Loki fills that gap: a log aggregation system built by the Grafana team specifically to live alongside Prometheus, using the same label model and the same Grafana UI you already have open.
This guide installs Loki as the central log store, deploys Promtail as the shipping agent on each host, wires it into your existing Grafana instance, and runs a real LogQL query.
Step 1: Why Loki Instead of a Full-Text Log Stack
Unlike Elasticsearch-based stacks (which we covered in our Elasticsearch index cleanup script), Loki doesn’t index the full text of every log line — it only indexes labels (like host, job), and stores log content as compressed chunks. That trade-off makes it dramatically cheaper to run at small-to-medium scale, at the cost of full-text search being somewhat slower than a dedicated search engine.

Step 2: Install Loki
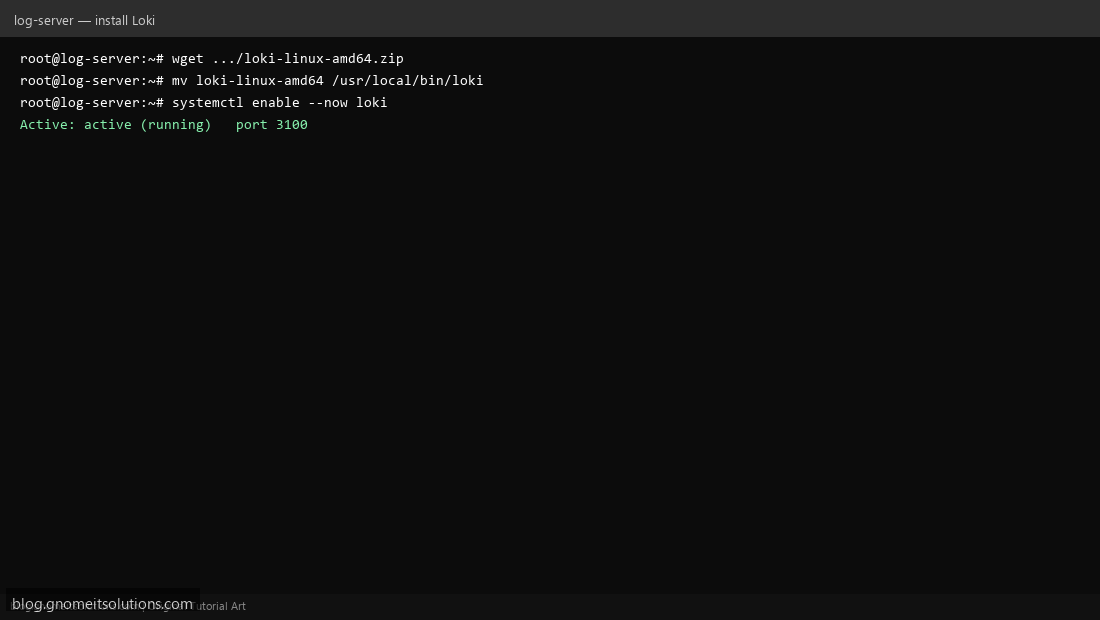
On your monitoring server (same box as Prometheus/Grafana works fine for small setups): download the Loki binary, place it at /usr/local/bin/loki, and run it as a systemd service with a config file defining local storage. Confirm it’s listening on port 3100.
Step 3: Install and Configure Promtail on Each Host
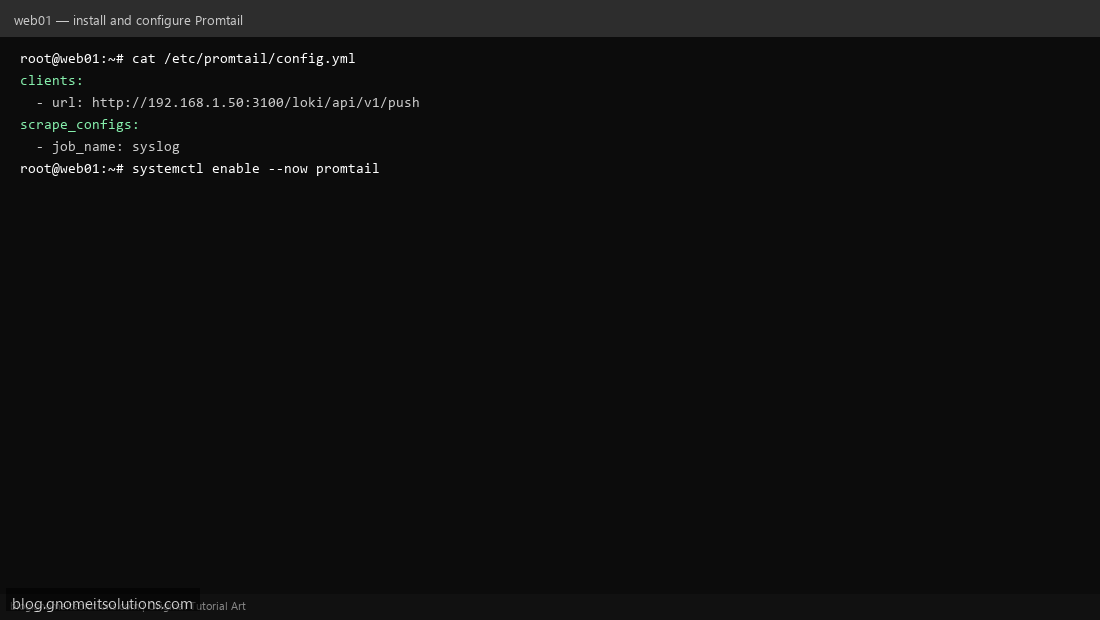
On every server you want logs from, install promtail and point its clients.url at your Loki server’s push endpoint (http://192.168.1.50:3100/loki/api/v1/push). Add a scrape_configs job for /var/log/syslog (or journald directly on systemd distros) so Promtail tails and forwards new log lines continuously.
Step 4: Add Loki as a Grafana Data Source
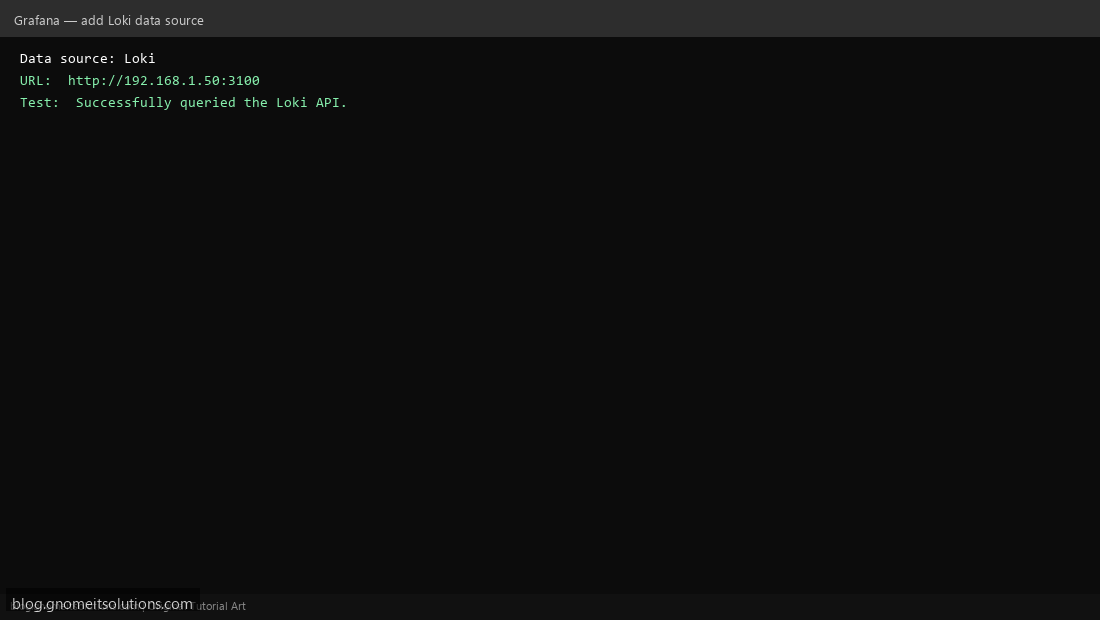
In Grafana: Connections → Data Sources → Add → Loki, URL http://192.168.1.50:3100, Save & Test. This is the same workflow as connecting Prometheus — Loki and Prometheus can now sit side by side as data sources in the same Grafana instance.
Step 5: Query Logs With LogQL
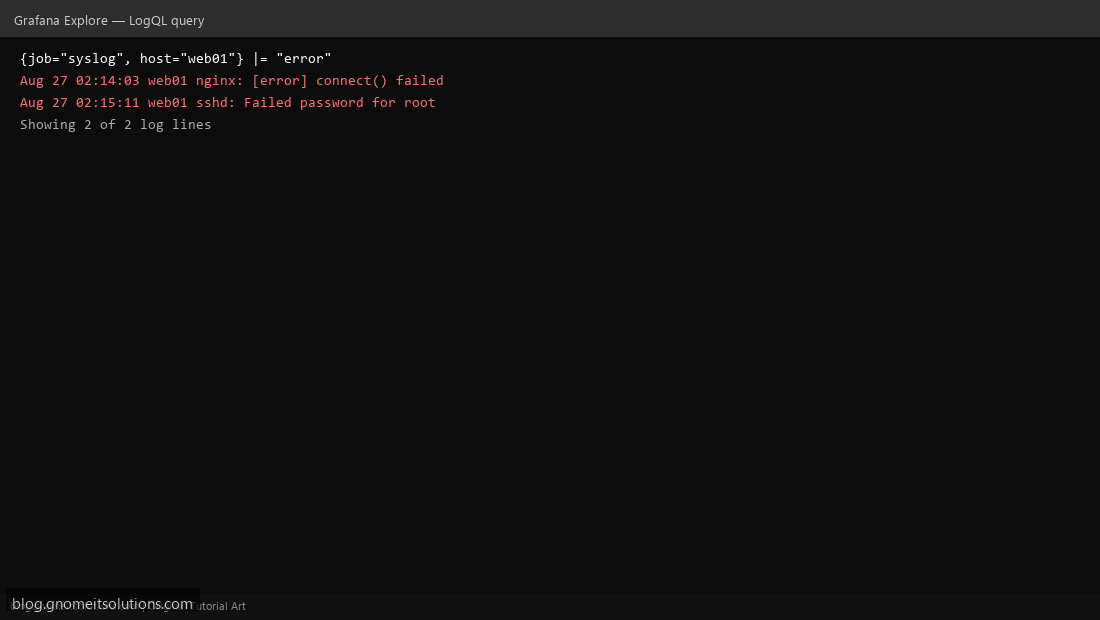
In Grafana → Explore, select the Loki data source and run a LogQL query: {job="syslog", host="web01"} |= "error" — this selects the log stream by label (fast) and then filters for the text “error” within it. LogQL’s label-first filtering is exactly how Loki stays cheap: you narrow down by label before doing any text scanning.
Step 6: Correlate Logs With Metrics
Because Loki and Prometheus share Grafana, you can put a metrics panel (CPU spike) and a logs panel (errors from that same host, same time range) on one dashboard. Click a spike in the metrics panel and Grafana can jump the logs panel to that exact time window — this correlation is the actual payoff of running both stacks together instead of separate tools.
Step 7: Set Retention to Control Disk Usage
Loki’s default config keeps logs indefinitely, which will eventually fill your disk. Set retention_period in Loki’s config (e.g. 720h for 30 days) and enable the compactor to actually enforce it — without the compactor running, the retention setting is silently ignored and old chunks pile up regardless.
Example Promtail config
server:
  http_listen_port: 9080

clients:
  - url: http://192.168.1.50:3100/loki/api/v1/push

scrape_configs:
  - job_name: syslog
    static_configs:
      - targets: [localhost]
        labels:
          job: syslog
          host: web01
          __path__: /var/log/syslog
Related tutorials
- Prometheus + Grafana Monitoring
- Elasticsearch Index Cleanup Shell Script
- Nginx Log Analyzer Shell Script
Terminal screenshots are original illustrations created for Gnome IT Solutions (blog.gnomeitsolutions.com).