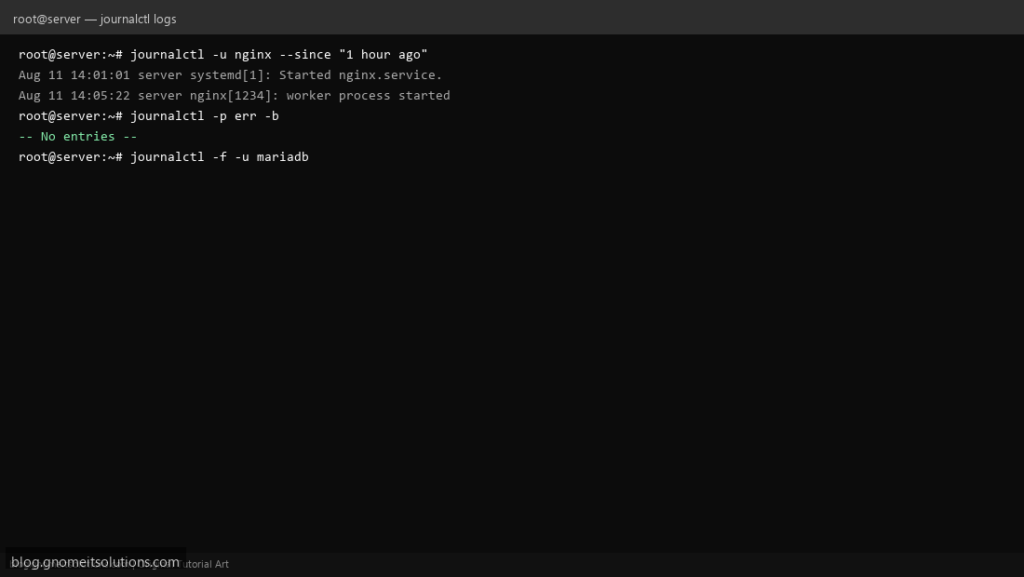
systemd keeps a single structured log for the kernel and every unit it manages, and journalctl is the one tool that reads all of it. Instead of
hunting across half a dozen files under /var/log, you filter one journal by service, time window or severity.
This guide covers the filters you will use daily, reading logs from a previous boot after a crash, making the journal survive a reboot (it does not by
default on many installs), and capping how much disk it is allowed to use.
Quick answer: journalctl -u servicename -f to follow one service’s logs live, journalctl -p err -b for errors since the last boot.
Where journalctl’s Data Comes From
The kernel and every systemd-managed unit write structured entries to journald, which stores them (often in binary form) and answers queries from journalctl.
kernel + systemd units --> journald (stores entries) --> journalctl (your queries)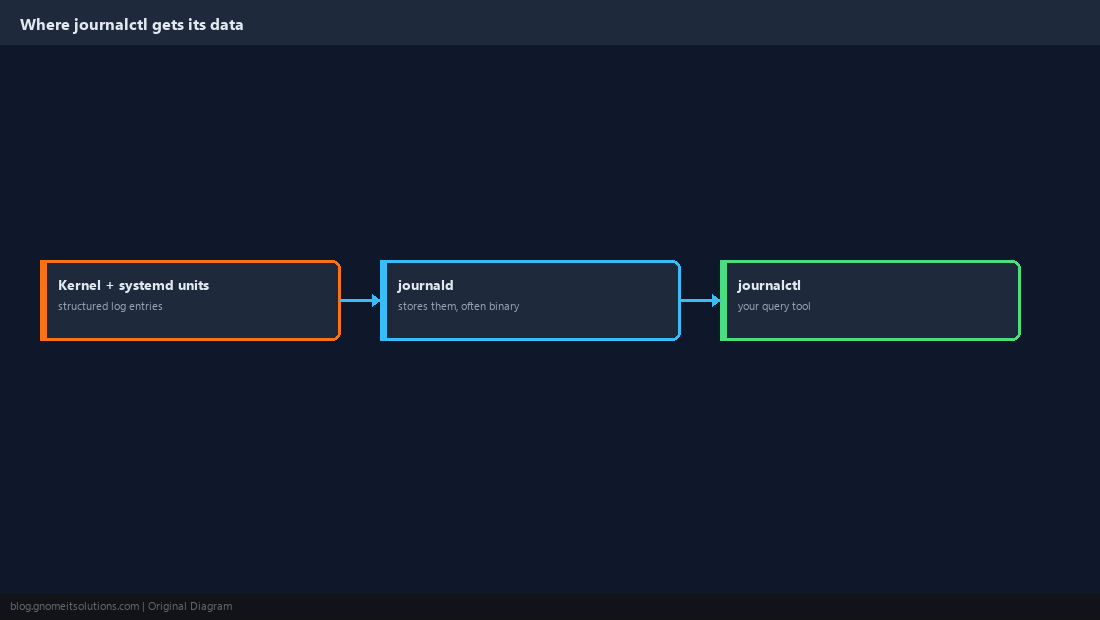
The Default View, and Jumping to the End
Plain journalctl shows everything, oldest first, which is rarely what you want on a busy server. Jump to the end or follow it live instead.
journalctl            # everything, oldest first, paged
journalctl -e          # jump to the end
journalctl -f          # follow new entries live, like tail -f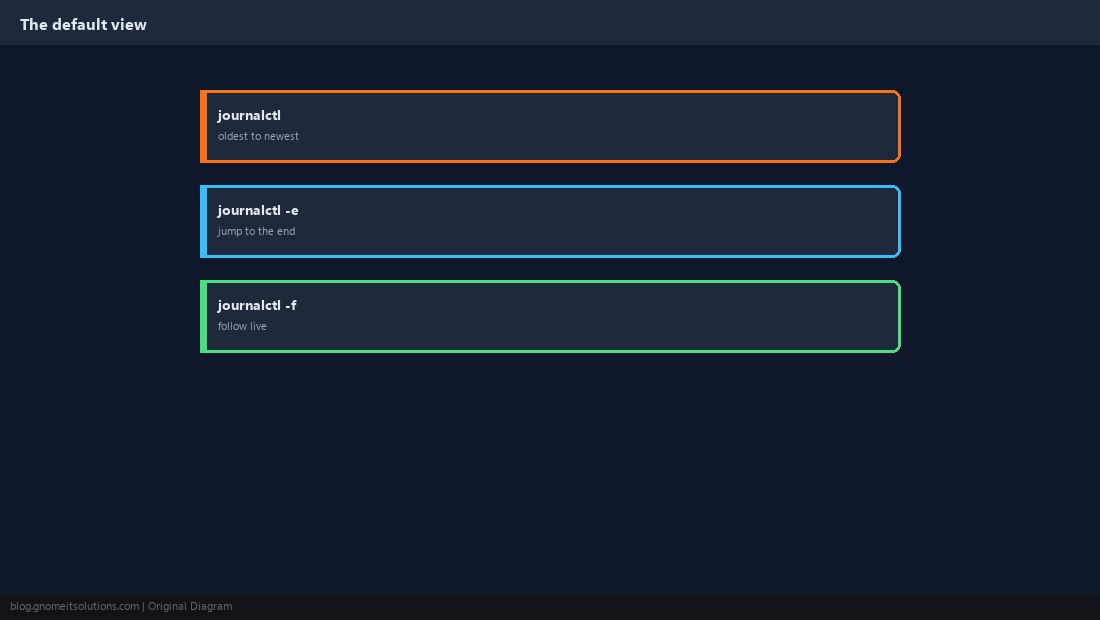
Filter by Unit
This is the single most useful filter. It shows only entries from the units you name, instead of every message on the system.
journalctl -u nginx --no-pager | tail -30
journalctl -u nginx -u php-fpm -f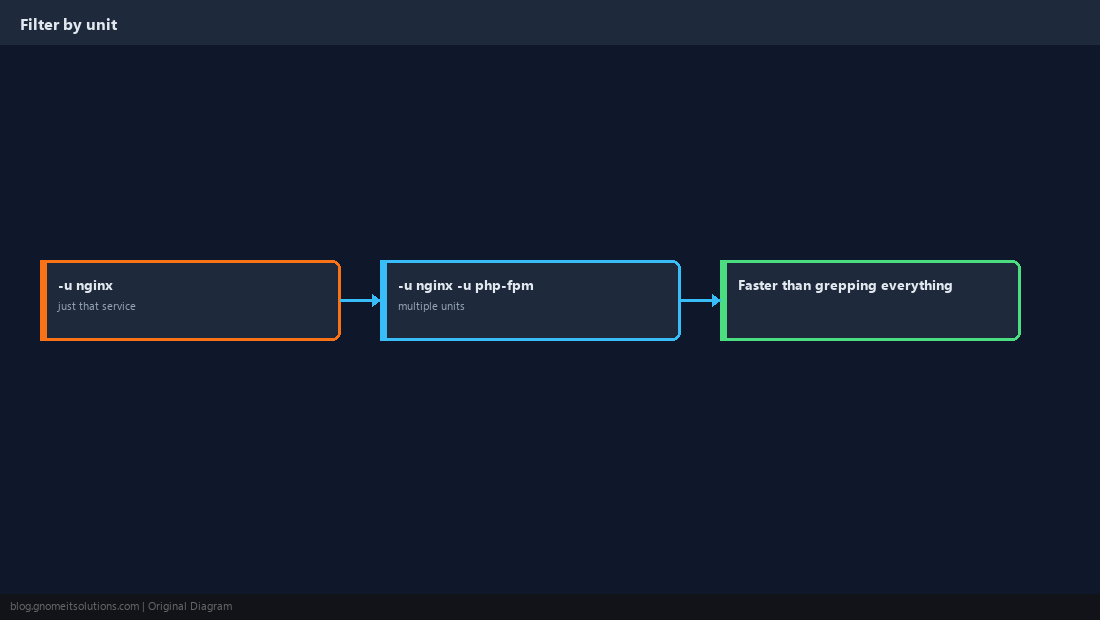
Filter by Time Window
Narrow to exactly the period you care about, especially useful right after an incident.
journalctl --since today
journalctl --since '1 hour ago'
journalctl --since '2026-09-20 14:00' --until '2026-09-20 15:00'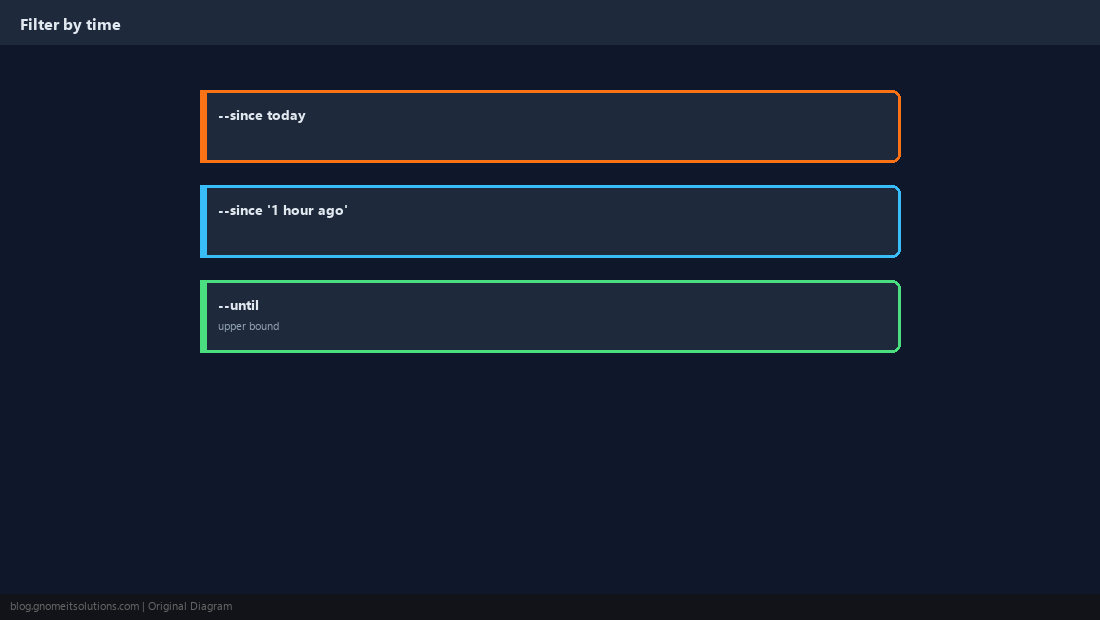
Filter by Severity
-p filters by priority level and includes everything at or above it, so -p err shows errors, critical, alert and emergency messages together.
journalctl -p err -b
journalctl -p warning -u nginx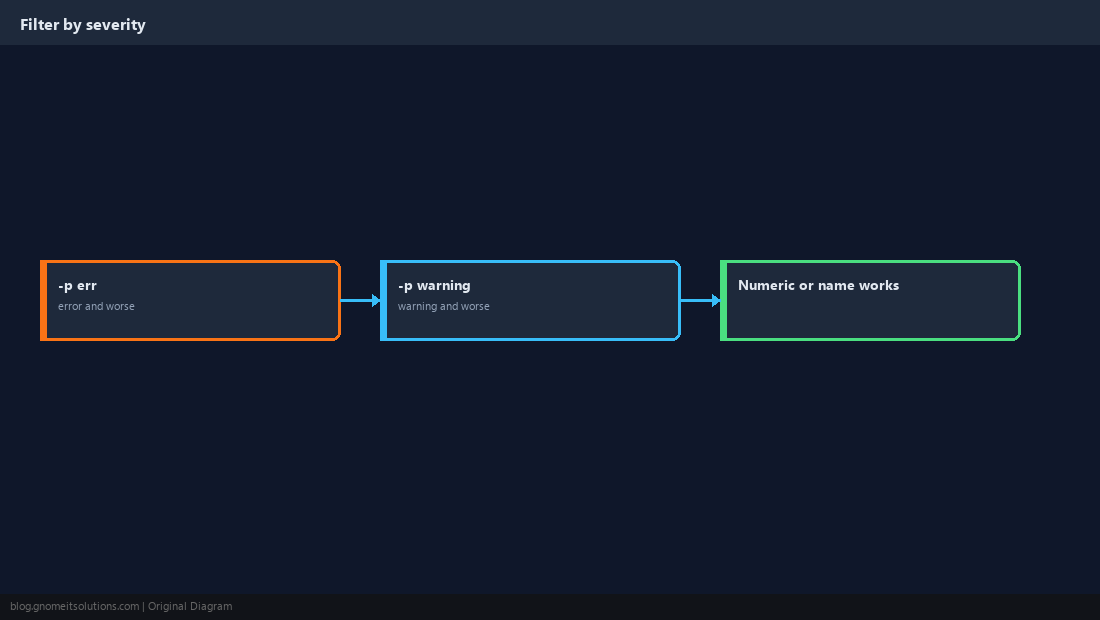
Read Logs From a Previous Boot
After an unexpected reboot or crash, the logs you need are usually from the boot before this one, not the current session.
journalctl -b            # current boot
journalctl -b -1         # previous boot
journalctl --list-boots  # see every boot the journal remembers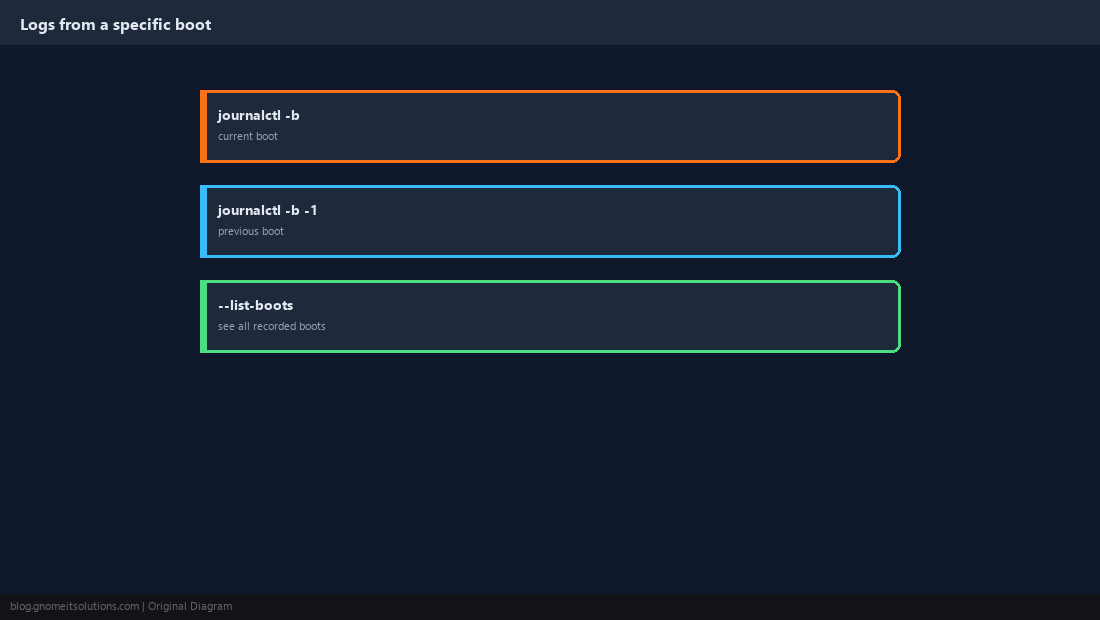
Make Logs Survive a Reboot
On some distributions the journal is volatile by default (kept in /run, wiped on reboot). Persistent storage is one directory away.
sudo mkdir -p /var/log/journal
sudo systemd-tmpfiles --create --prefix /var/log/journal
sudo systemctl restart systemd-journaldStorage=persistent
SystemMaxUse=500MSystemMaxUse, a persistent journal can grow to consume a large share of the disk over time on a busy server.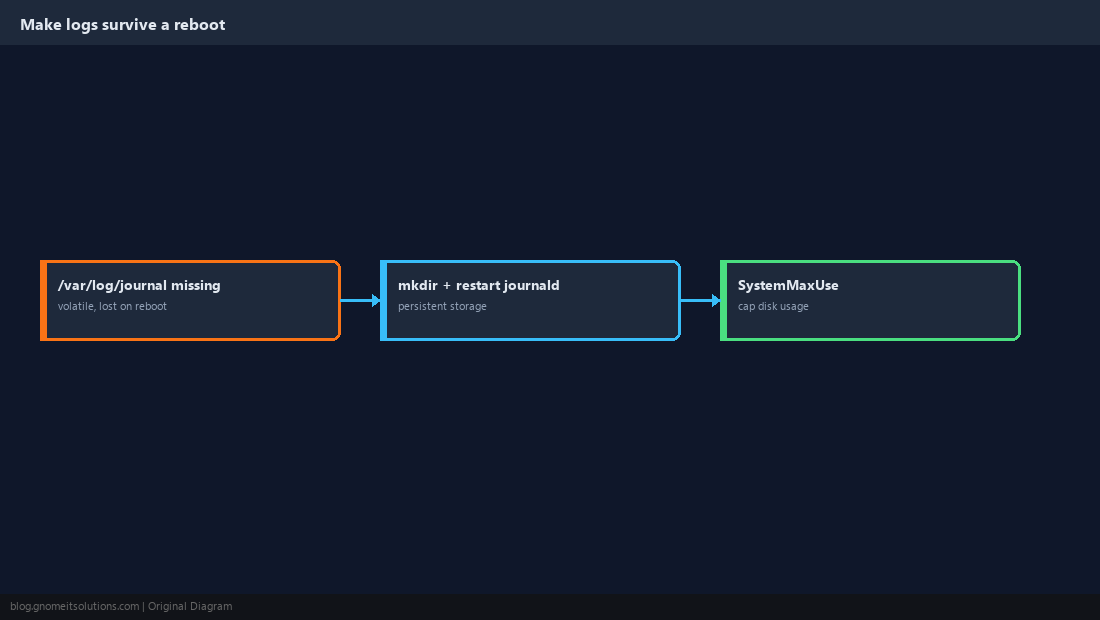
Export and Combine with Other Tools
For scripting or feeding into another system, structured output beats scraping plain text. Combine journalctl’s own filters with grep for a quick text search across a narrowed set of entries.
journalctl -u nginx -o json-pretty --no-pager | head -40
journalctl -u nginx --no-pager | grep -i 'error\|timeout'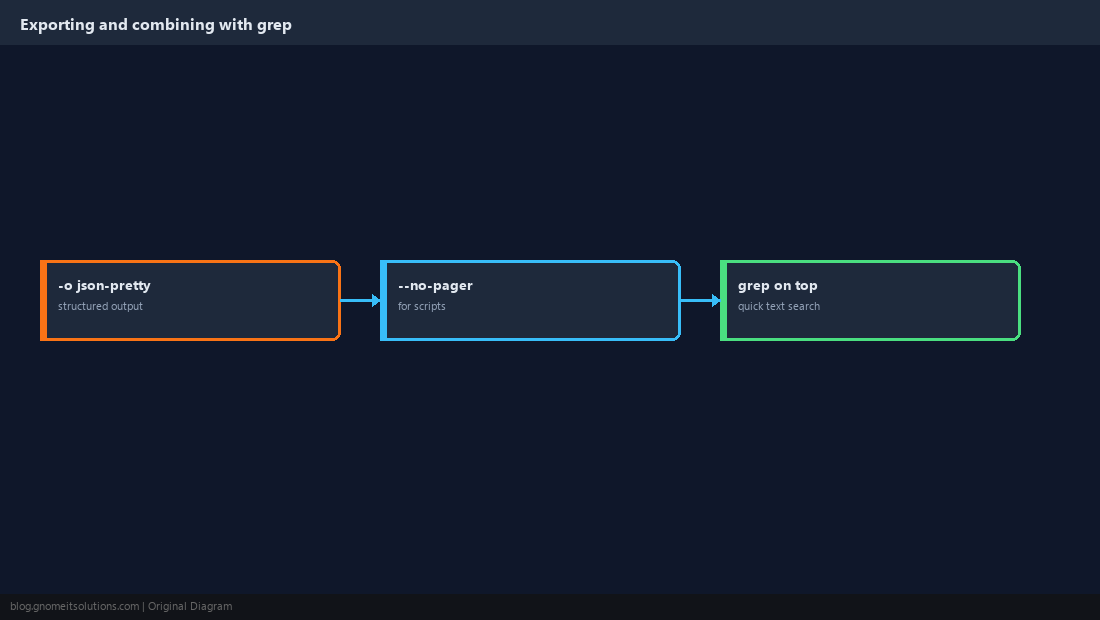
How do I see logs for a specific service?
Run journalctl -u servicename. Add -f to follow new entries as they happen, the same way tail -f works on a plain log file.
Why do my logs disappear after a reboot?
The journal is stored in volatile memory (/run) by default on many installs. Create /var/log/journal and restart systemd-journald to switch to persistent, disk-backed storage.
How do I filter journalctl by date?
Use –since and –until with a date, a time, or a relative phrase like ‘1 hour ago’ or ‘yesterday’. Combine them to bound both ends of a window.
How do I see only errors in the journal?
journalctl -p err shows entries at error severity or worse. Replace err with warning, crit or emerg for a different threshold.
How do I stop the journal from filling the disk?
Set SystemMaxUse (and optionally SystemKeepFree) in /etc/systemd/journald.conf, or run journalctl –vacuum-size=500M to trim it immediately.
Cheat Sheet
-u namefilter by unit;-ffollow live;-b/-b -1by boot--since/--untilby time;-p errby severity- Persistent storage needs
/var/log/journalto exist plus a journald restart
Related tutorials
- systemctl: Managing Services
- systemd Journal Vacuum Script
- Centralized Logging with Loki and Promtail
Diagrams are original illustrations by Gnome IT Solutions. Tutorial text © Gnome IT Solutions.