Our Prometheus + Grafana and Loki guides cover metrics and logs — the two-thirds of “observability” most setups get to first. The third piece, distributed tracing, answers a question neither metrics nor logs handle well on their own: when a single user request touches five different services, which one is actually slow? OpenTelemetry is the vendor-neutral standard for instrumenting applications to produce that trace data.
Step 1: Understand What a Trace Actually Is
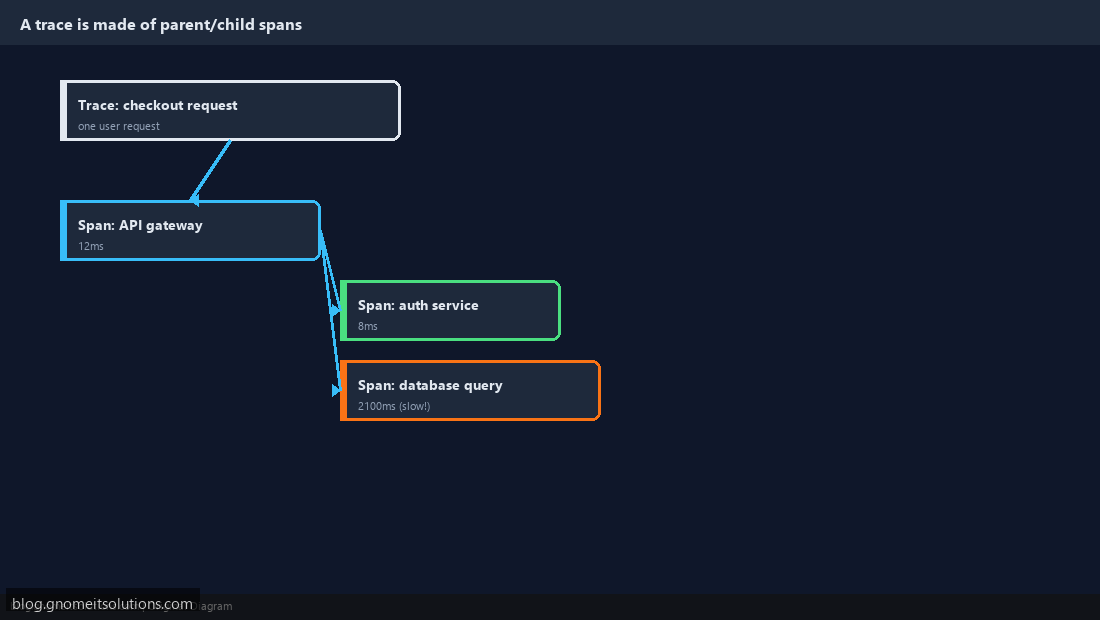
A trace represents one request’s full journey through a system, made up of spans — each span is one unit of work (an HTTP call, a database query) with a start time, duration, and parent-child relationship to other spans. Looking at a trace visually shows you exactly which span in a five-service call chain took 2 seconds while the rest took milliseconds — something a single service’s own logs can never show in isolation.
Step 2: Understand the Pipeline Shape
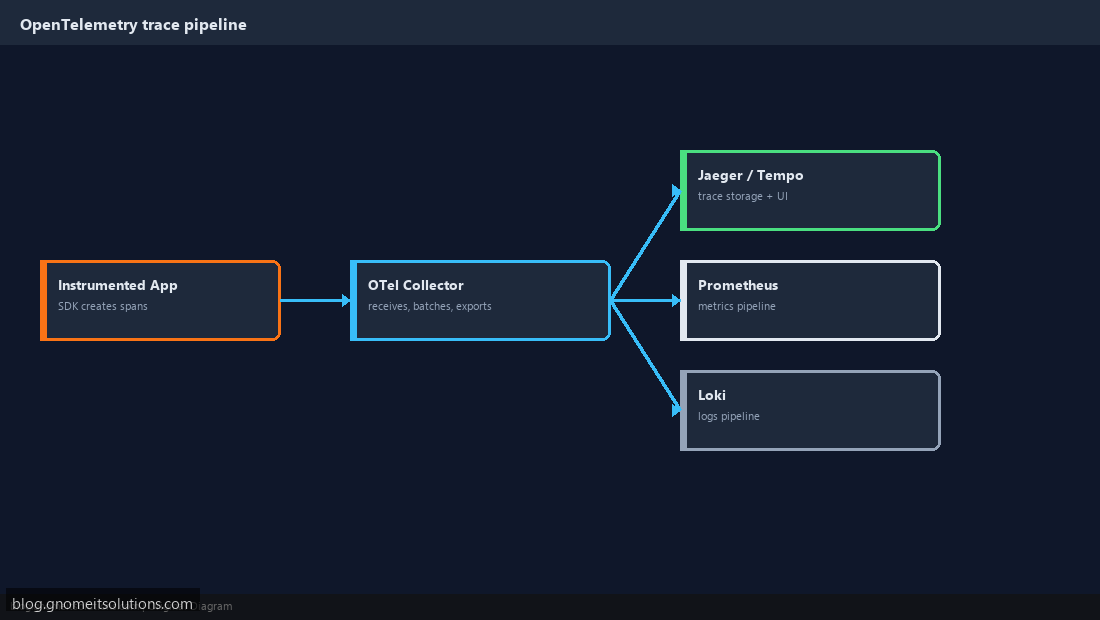
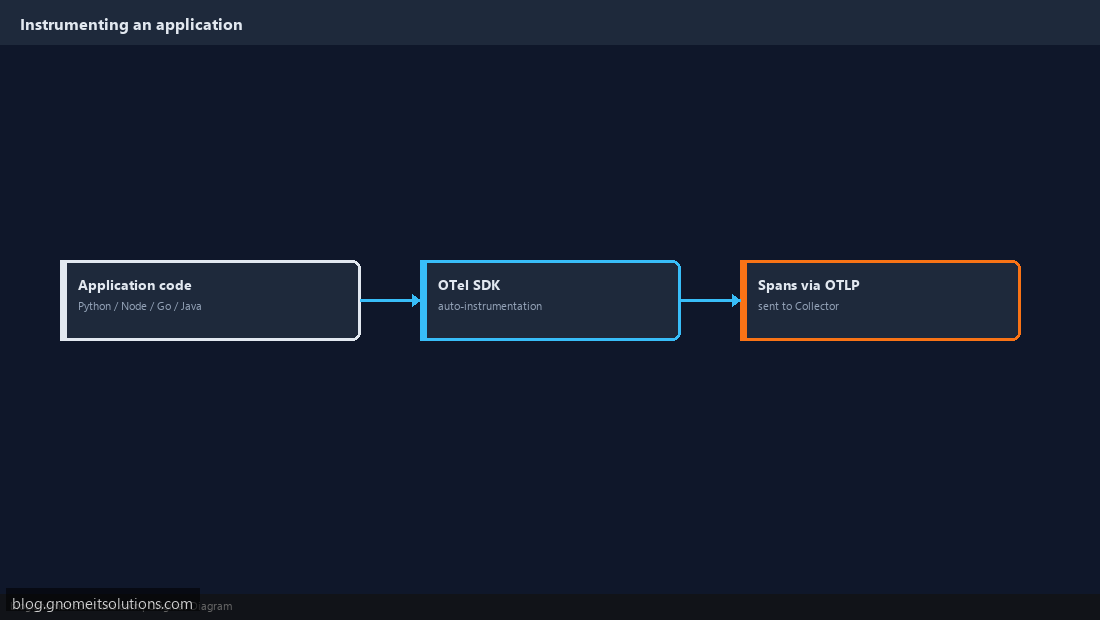
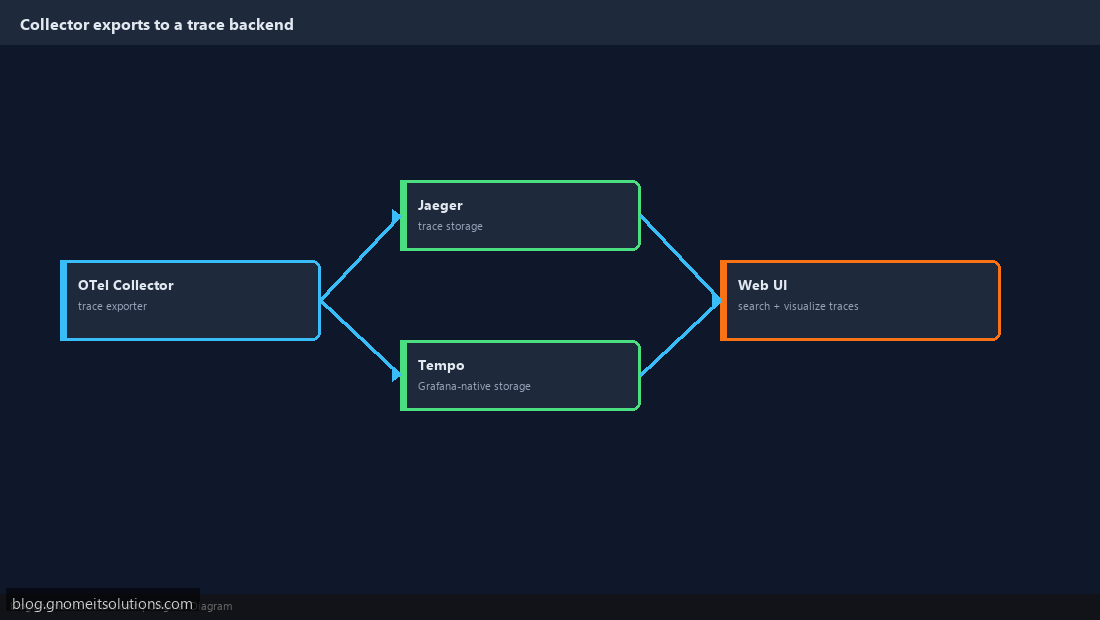
The standard OpenTelemetry pipeline: an instrumented application (using an OTel SDK for its language) generates spans, sends them to the OpenTelemetry Collector (a separate process that receives, batches, and processes telemetry), which then exports to a backend — Jaeger or Tempo for traces specifically, but the same Collector can also forward metrics to Prometheus and logs to Loki, unifying all three signal types through one pipeline.
Step 3: Install and Run the Collector
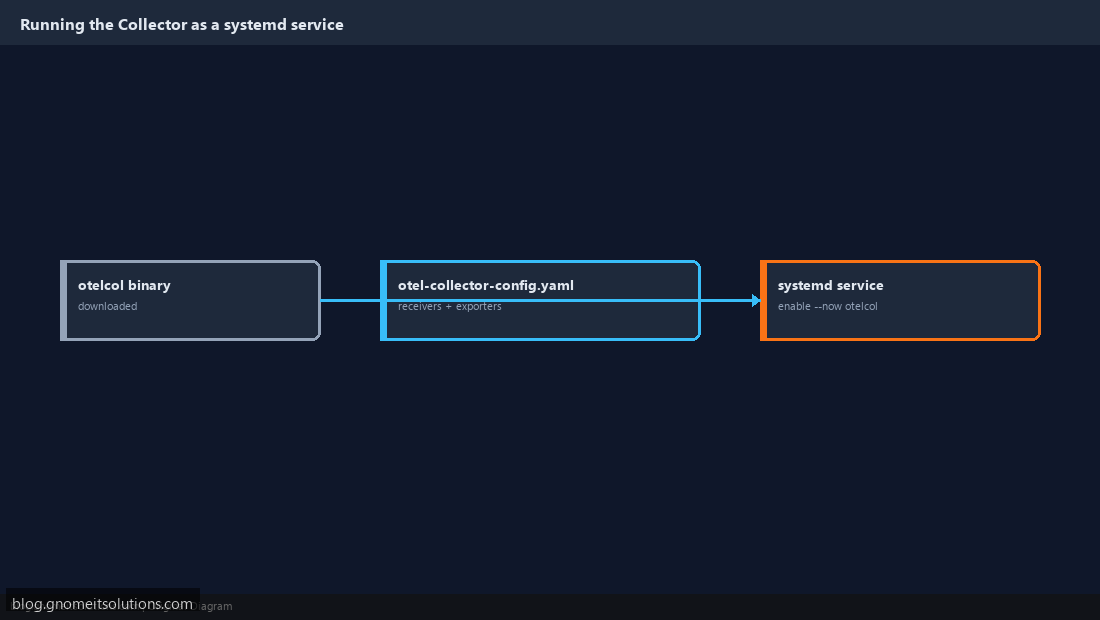
Download the otelcol binary (or run it as a container), configure otel-collector-config.yaml with a receiver (typically OTLP, the standard OpenTelemetry protocol, over gRPC or HTTP), and an exporter pointing at your tracing backend. Run it as a systemd service, following the same pattern as our custom systemd unit guide.
Step 4: Instrument an Application
Add the OpenTelemetry SDK for your application’s language (Python, Node.js, Go, Java all have official SDKs) and configure it to export via OTLP to your Collector’s address. Many frameworks support auto-instrumentation — wrapping common libraries (HTTP clients, database drivers) automatically so you get useful spans without manually annotating every function call.
Step 5: Deploy a Trace Backend
Jaeger is the most established open-source option — run it (commonly via Docker Compose for a quick start), point the Collector’s trace exporter at it, and browse to Jaeger’s UI to search and visualize traces by service, operation, or duration. Tempo (from the Grafana team) is a lower-cost alternative that integrates directly into the same Grafana instance already running your Prometheus and Loki dashboards.
Step 6: Correlate Traces With Metrics and Logs
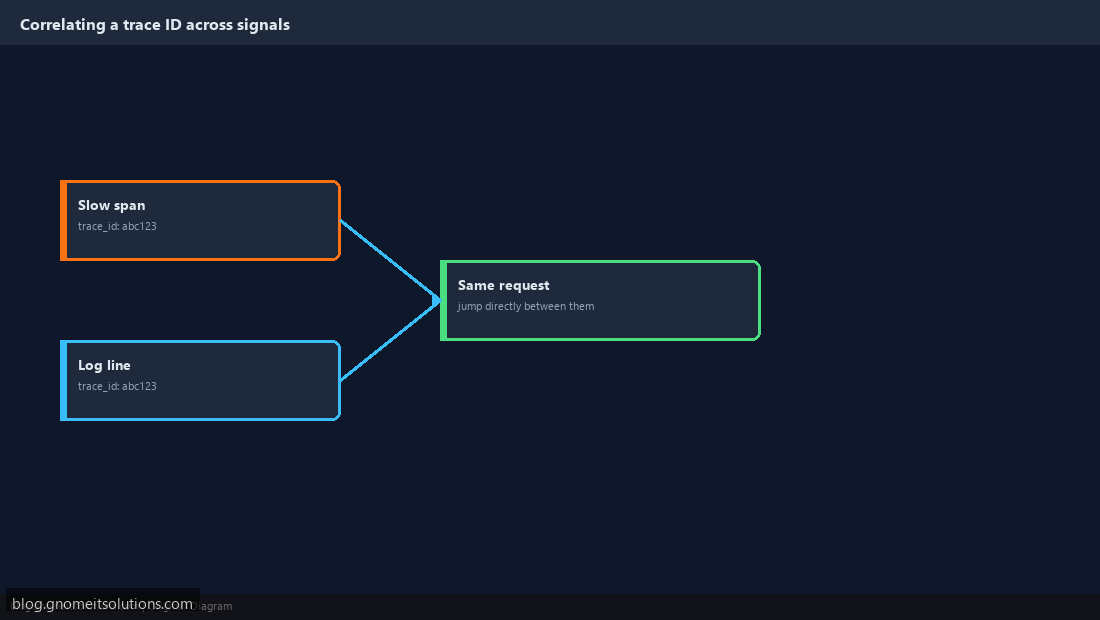
The real payoff of a unified Collector pipeline: a slow trace span can carry a trace ID that also appears in the corresponding log line (if your logging library is trace-aware) — letting you jump from “this span was slow” directly to “here’s the exact log output from that specific request,” rather than guessing which log lines among thousands belong to the slow request.
Step 7: Sample Traces to Control Volume
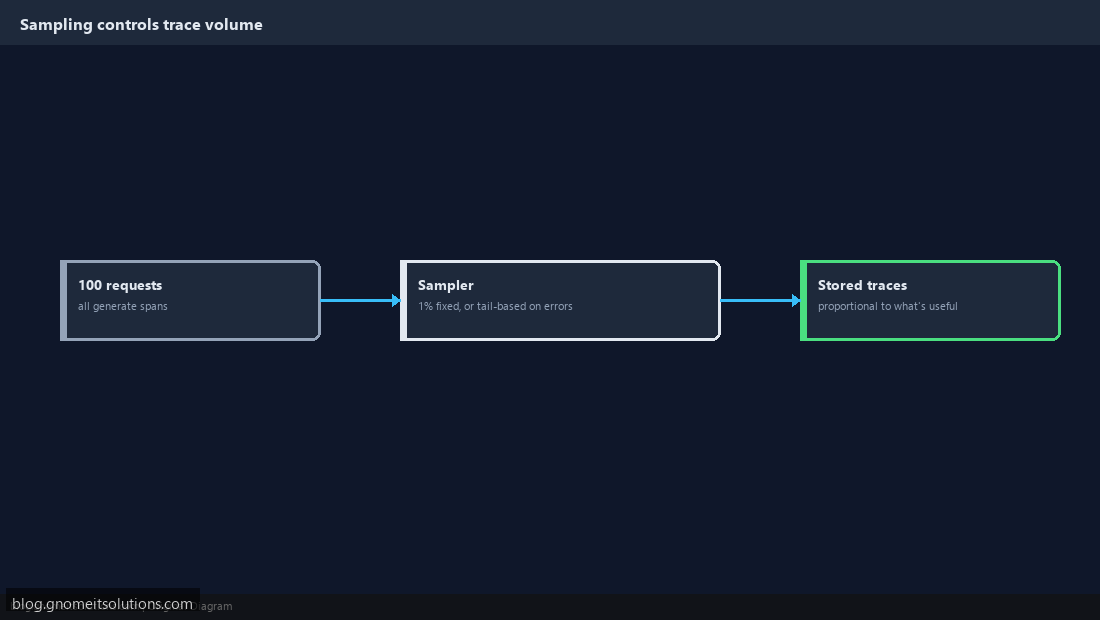
Tracing every single request in a high-traffic service generates enormous data volume. Configure sampling — either a fixed percentage (trace 1 in 100 requests) or tail-based sampling (keep only traces that were slow or errored, decided after the fact) — in the Collector or SDK config, so storage and processing costs stay proportional to what’s actually useful to keep.
Step 8: Use Traces to Diagnose a Real Slow Request
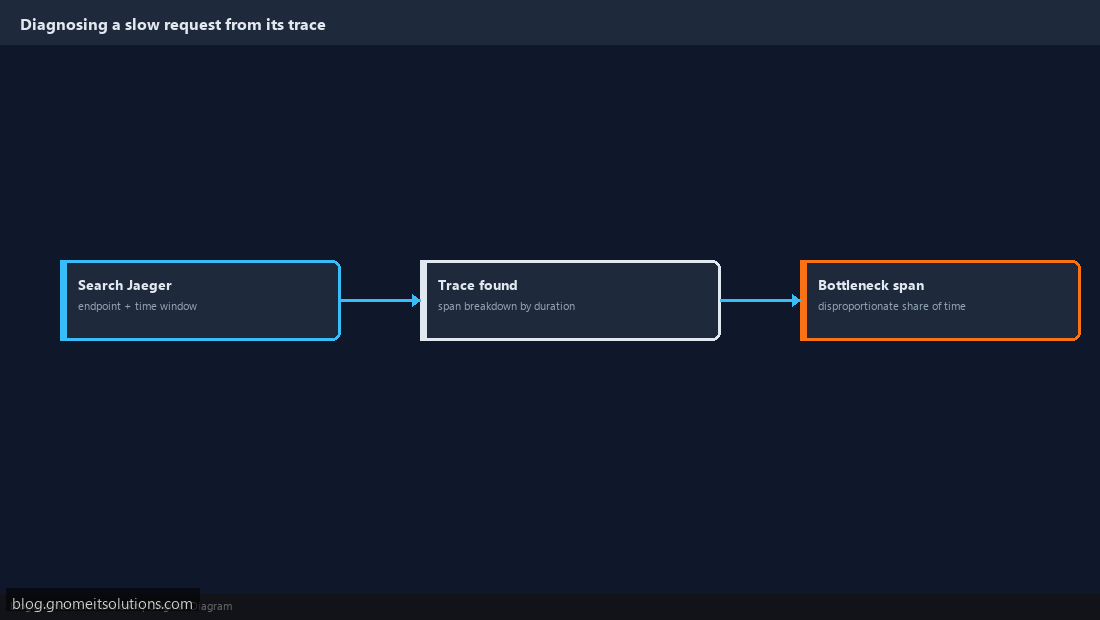
When a user reports a slow page load, search Jaeger for traces matching that endpoint and time window, then look at the span breakdown — a single span with a disproportionate share of total duration is almost always the actual bottleneck. This is a far more direct diagnosis path than the trial-and-error of checking each service’s own metrics one at a time hoping to spot the slow one.
Example Collector config
receivers:
  otlp:
    protocols:
      grpc:
      http:

exporters:
  jaeger:
    endpoint: jaeger:14250
    tls:
      insecure: true

service:
  pipelines:
    traces:
      receivers: [otlp]
      exporters: [jaeger]
Related tutorials
- Prometheus + Grafana Monitoring
- Centralized Logging with Loki + Promtail
- Kubernetes Cluster Setup with kubeadm
Terminal screenshots are original illustrations created for Gnome IT Solutions (blog.gnomeitsolutions.com).