
When htop shows something odd, vmstat and iostat give a compact time series you can log during an incident.
Install sysstat if iostat is missing. Pair disk findings with
df/du/ncdu when space is tight but I/O is the symptom.
Two Complementary Tools
vmstat summarises CPU, memory, and block I/O. iostat breaks out per-disk throughput and latency.
sudo apt install -y sysstat # or: sudo dnf install -y sysstat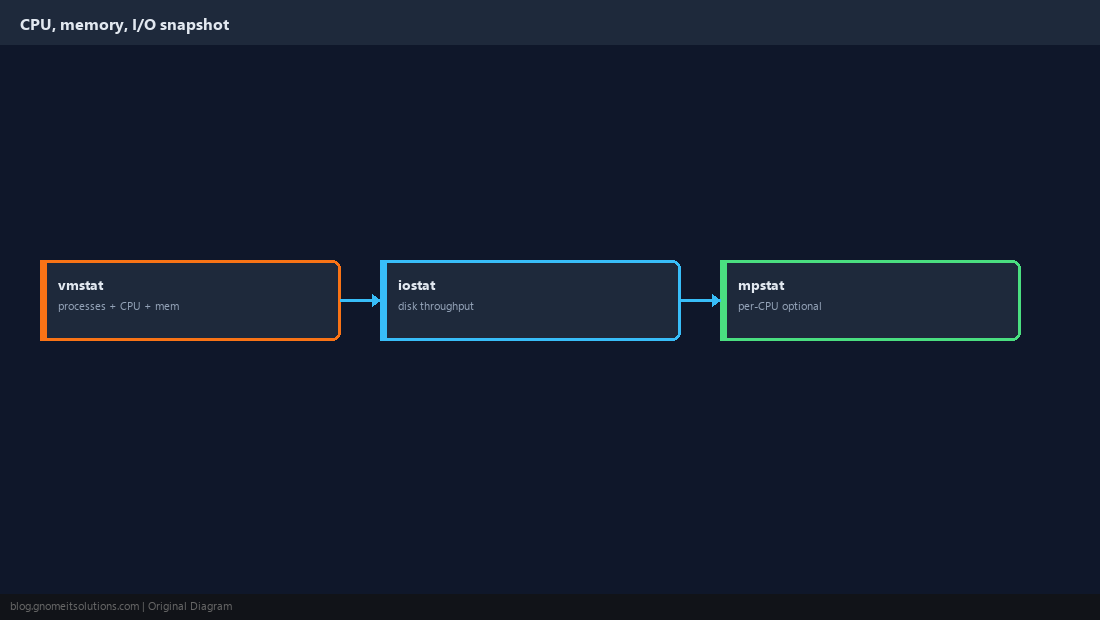
vmstat Header and Process Columns
r is runnable tasks; b is uninterruptible sleep (often I/O). Sustained high b warrants disk investigation.
vmstat 1 5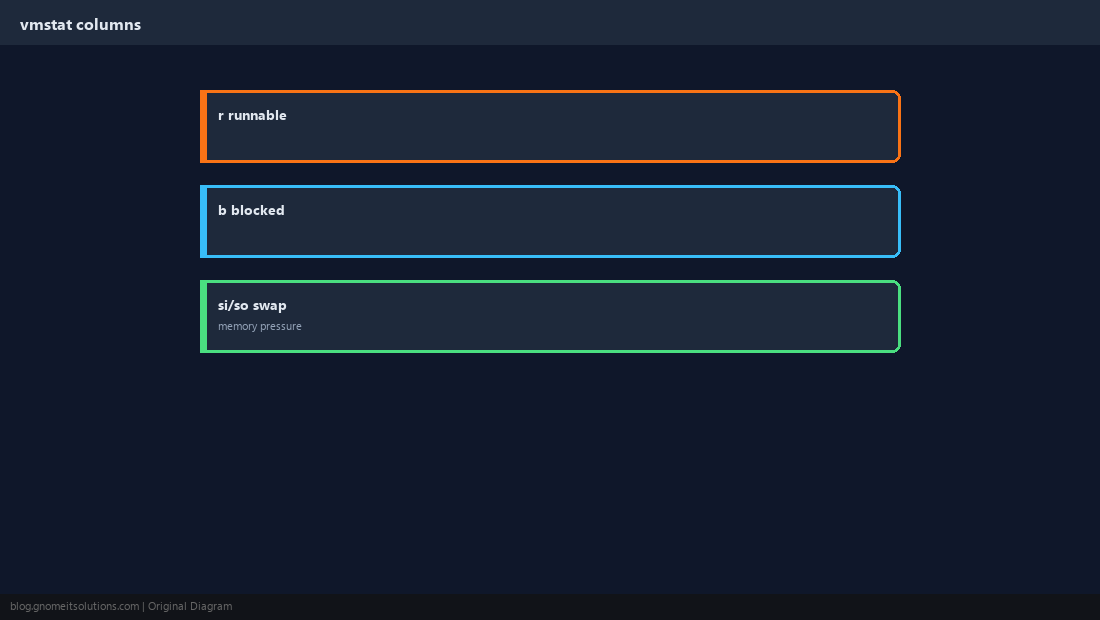
CPU Line: us, sy, wa
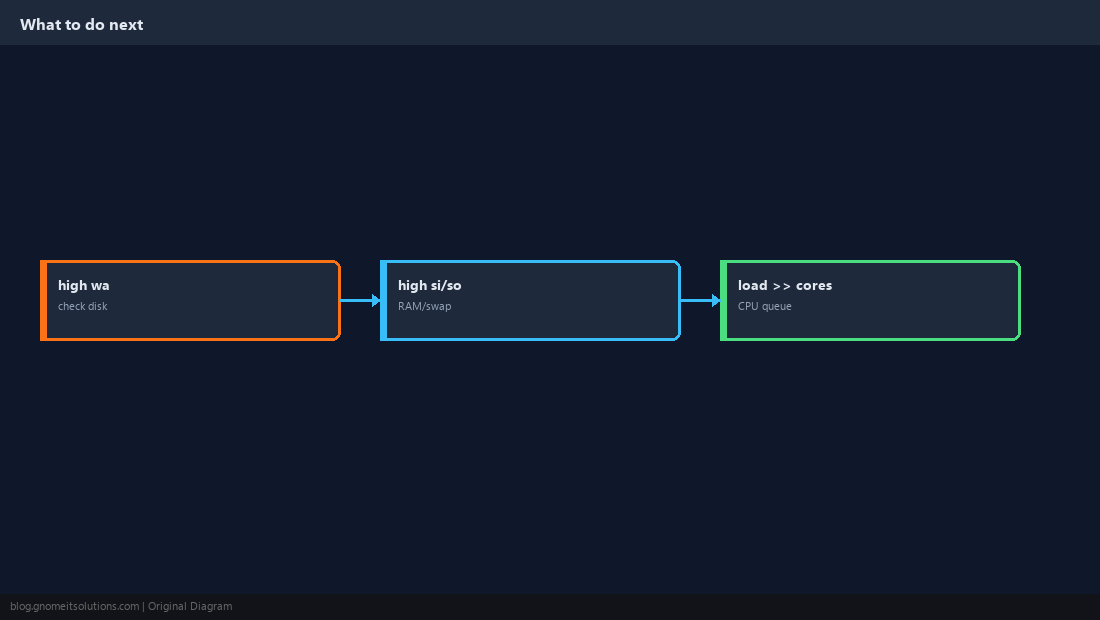
High wa (iowait) means CPUs are waiting on disk. High sy can mean excessive syscalls or drivers.
vmstat 1 | awk '{print $13,$14,$16}' # us sy wa on some layouts — read header row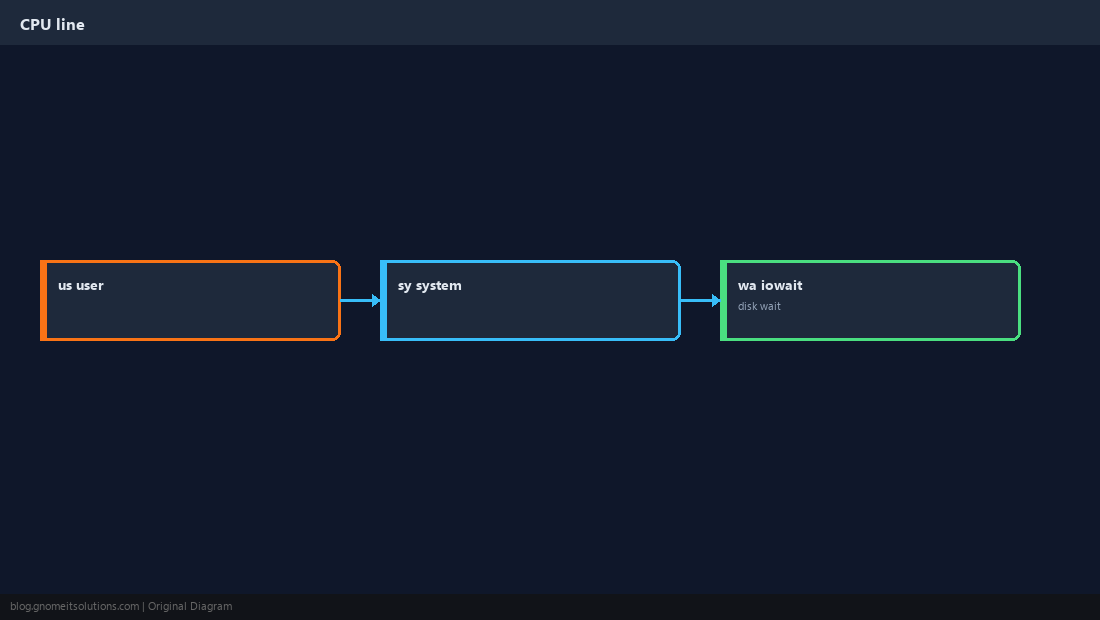
Memory and Swap Columns
si and so show swap pages moving in and out. Non-zero sustained values hurt latency.
free -h; vmstat 1 10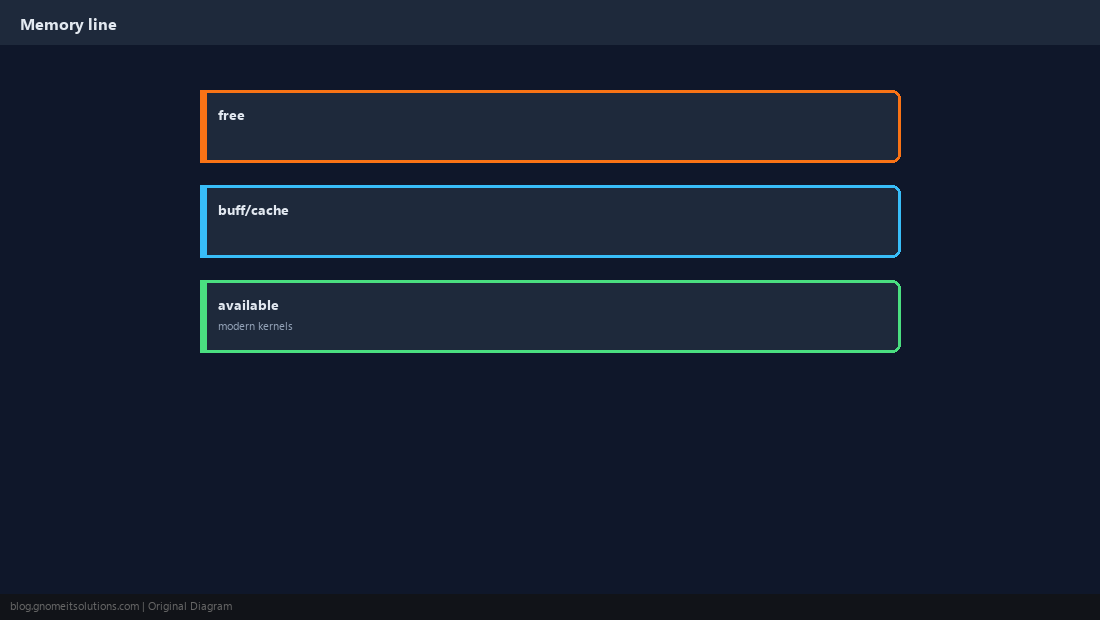
iostat for Disk Saturation
%util near 100% means the device is busy. await is average wait time per I/O request.
iostat -xz 1 5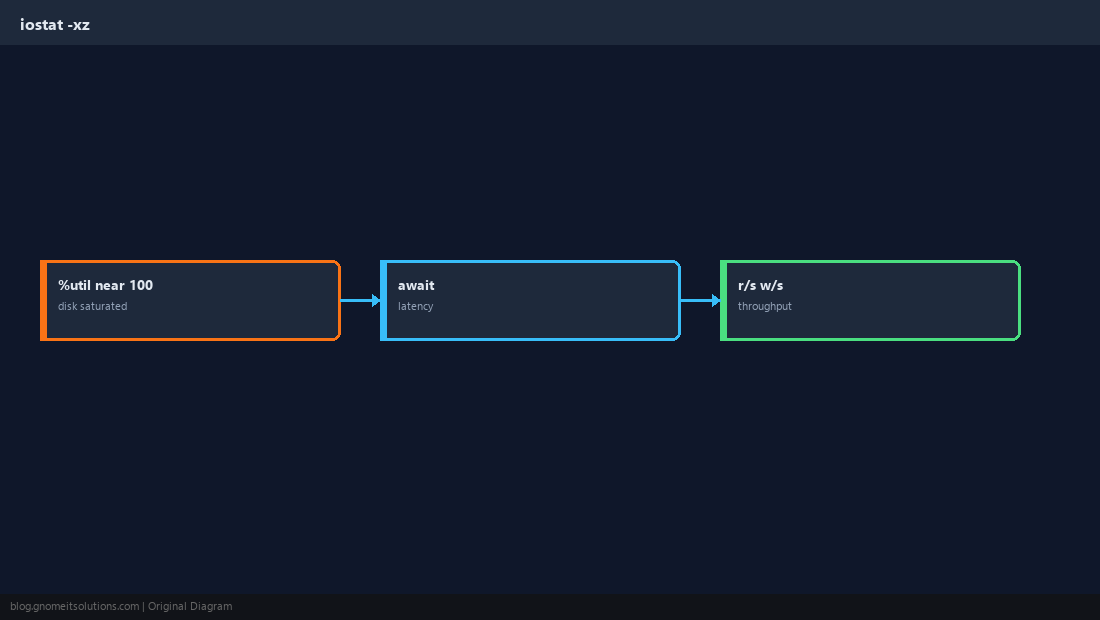
Log a Short Sample During Incidents
Capture 30–60 seconds while users complain; compare to a quiet baseline.
vmstat 1 30 | tee /tmp/vmstat-$(date +%F-%H%M).log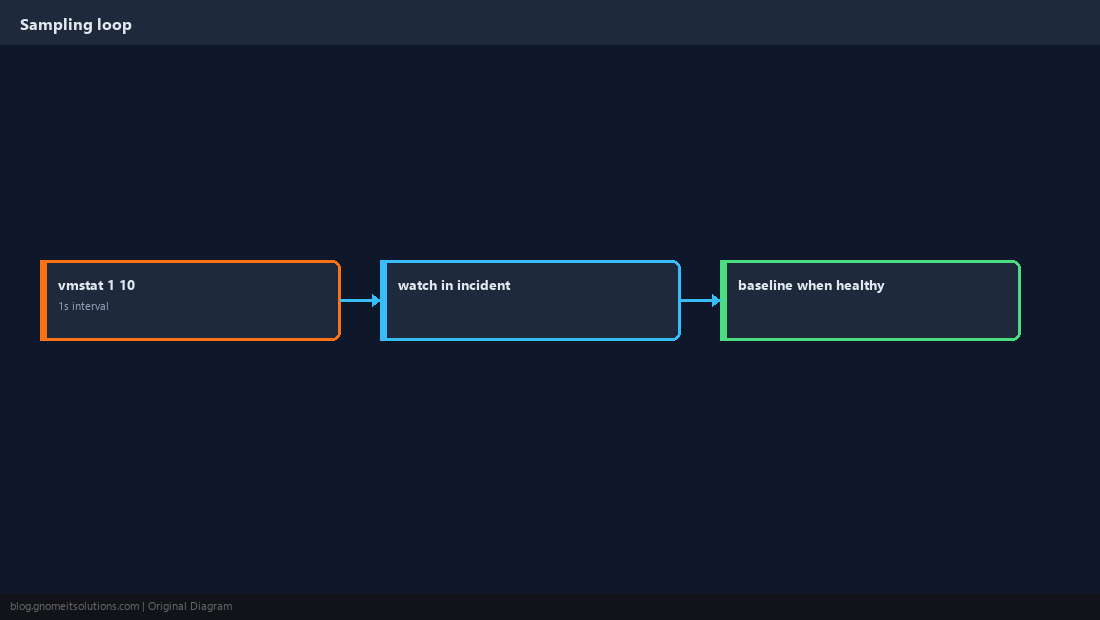
Translate Numbers Into Actions
High wa → disk or NFS. si/so → RAM or swap tuning. Load without wa → CPU-bound workload.
Quick Reference
vmstat 1 10— quick CPU/mem/swap series- High
wa→ disk;si/so→ swap pressure iostat -xz 1for per-disk %util
Related tutorials
Diagrams are original illustrations by Gnome IT Solutions. Tutorial text © Gnome IT Solutions.