
The shell scripts in our server health check series are great for single-server alerting, but once you’re running more than a handful of machines you want history, graphs, and one dashboard that covers everything. Prometheus pulls metrics from every server on an interval and stores them as time series; Grafana turns that time series into dashboards and alerts.
This guide installs Prometheus on a monitoring server, deploys the lightweight node_exporter agent on each target host, wires Grafana up as the visualization layer, and finishes with a real CPU alert rule.
Step 1: Plan the Architecture
You need one Prometheus server (the metrics database + scraper), node_exporter running on every host you want metrics from (it exposes CPU/memory/disk/network stats on port 9100), and Grafana (usually on the same box as Prometheus for a small setup) as the dashboard layer.

Step 2: Install Prometheus
Download the latest Prometheus release tarball, extract it to /opt/prometheus, and create a systemd unit that runs the prometheus binary with --config.file=/etc/prometheus/prometheus.yml. Start it with systemctl enable --now prometheus and confirm the web UI loads on port 9090.
Step 3: Install node_exporter on Each Target Host
On every host you want metrics from, download and run node_exporter as a systemd service — no configuration needed for basic metrics. It listens on :9100/metrics and exposes CPU, memory, disk, filesystem, and network statistics in Prometheus’s plain-text format.
Step 4: Configure Prometheus to Scrape the Targets
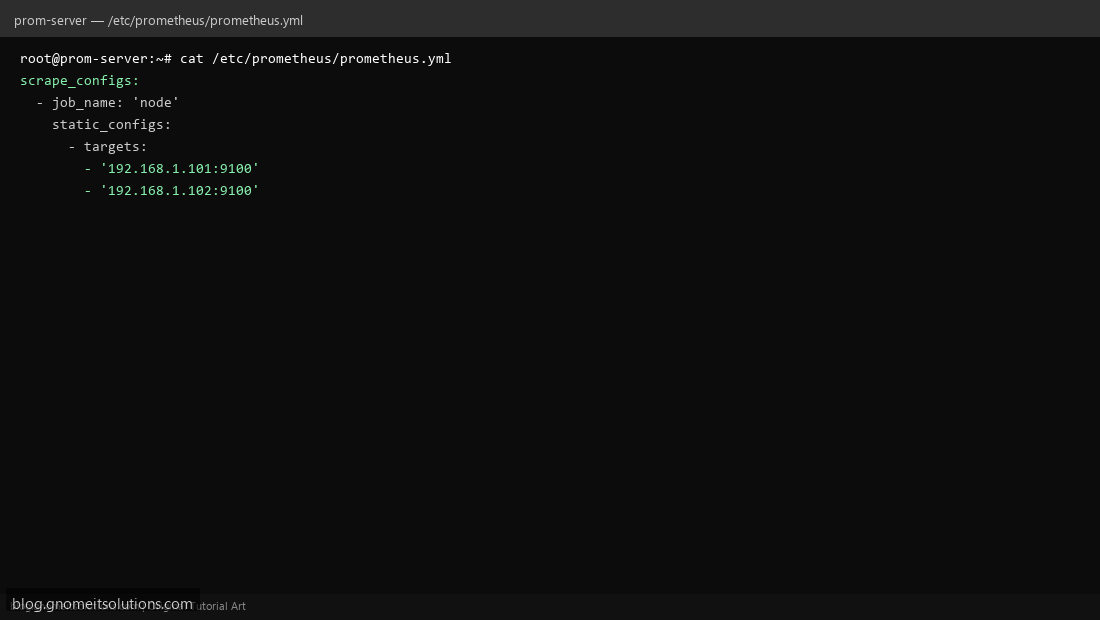
Edit /etc/prometheus/prometheus.yml and add a scrape_configs job named node listing each target’s IP:9100. Reload Prometheus (systemctl reload prometheus or send SIGHUP) to pick up the change without downtime.
Step 5: Verify Targets Are Being Scraped
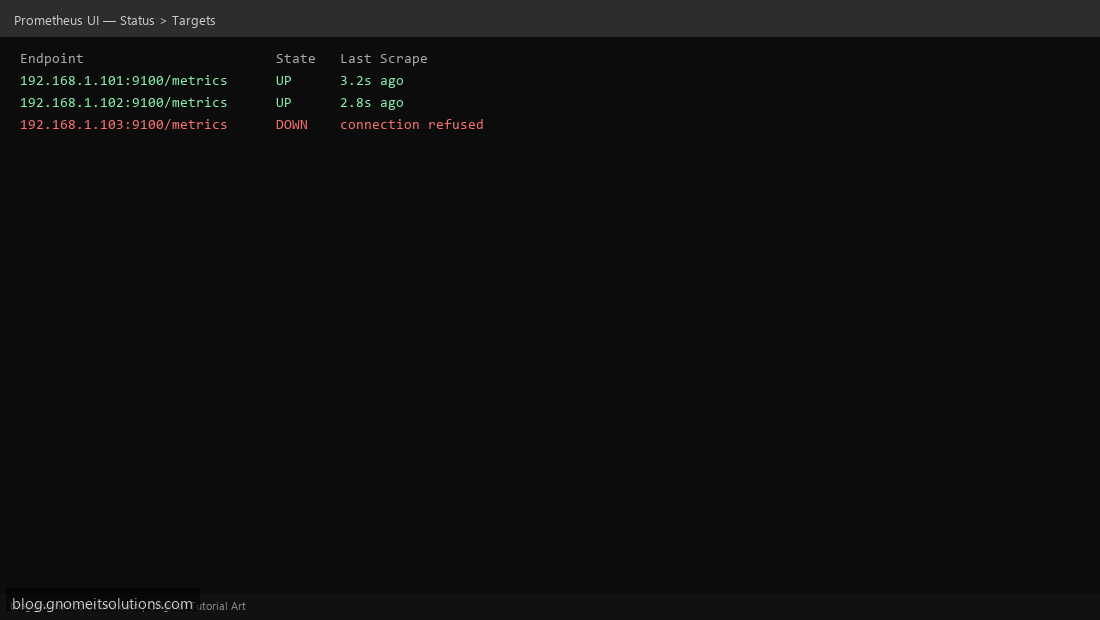
Open the Prometheus web UI → Status → Targets. Every target should show UP with a recent “last scrape” time. A target showing DOWN almost always means a firewall is blocking port 9100 or node_exporter isn’t running there — check both before assuming a Prometheus config bug.
Step 6: Install Grafana and Add Prometheus as a Data Source
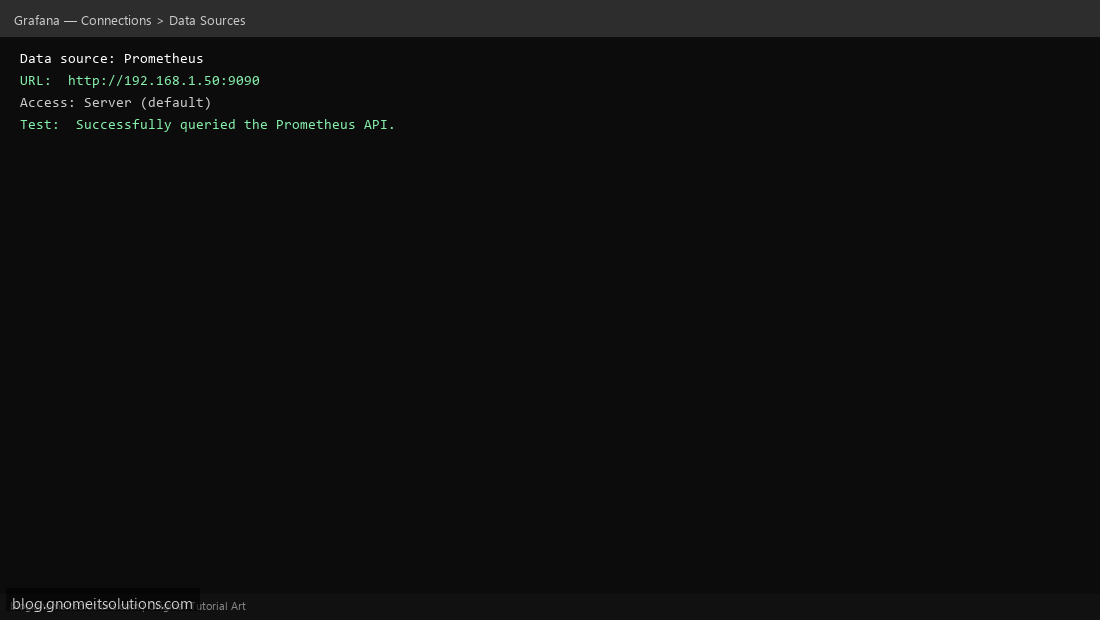
Install Grafana from its official apt repo, enable and start the service, then log into the web UI (default port 3000). Go to Connections → Data Sources → Add data source → Prometheus and point the URL at your Prometheus server (http://192.168.1.50:9090). Click Save & Test — you want to see a success message before moving on.
Step 7: Import a Dashboard
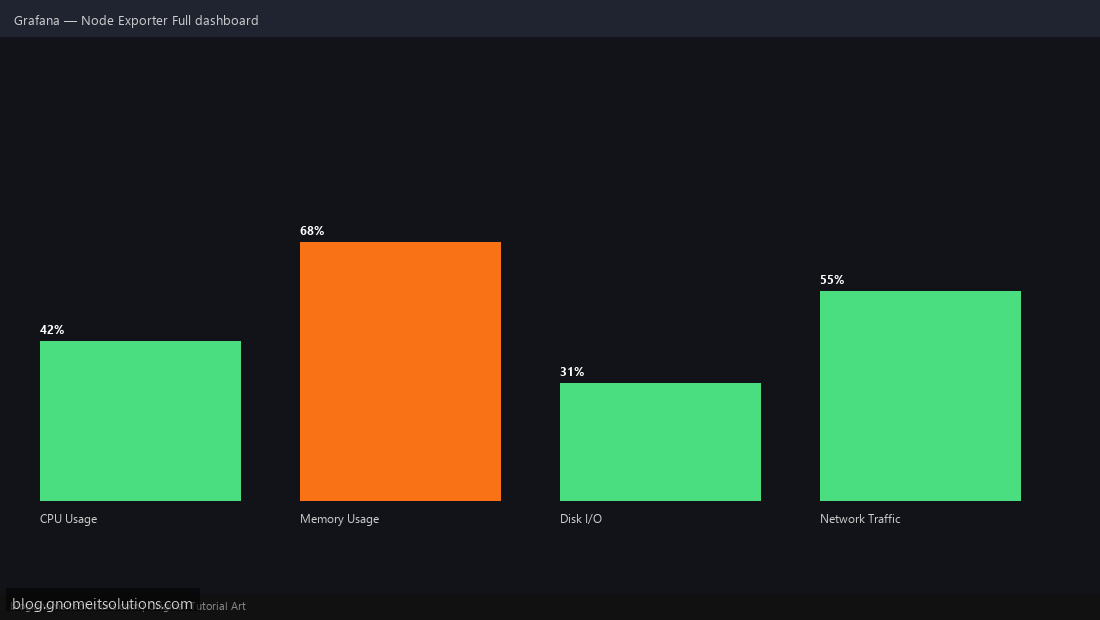
Rather than building panels from scratch, import a community dashboard: Dashboards → New → Import, and enter the well-known Node Exporter Full dashboard ID (1860) from grafana.com. Select your Prometheus data source and you immediately get CPU, memory, disk, and network panels for every scraped host.
Step 8: Create an Alert Rule
In Grafana, go to Alerting → Alert rules → New rule. Build a query against the CPU metric (e.g. 100 - (avg by (instance) (rate(node_cpu_seconds_total{mode="idle"}[5m])) * 100) > 85), set the evaluation interval, and attach a contact point (email, Slack webhook, etc.) so you get notified instead of having to watch the dashboard.
Example prometheus.yml scrape config
global:
  scrape_interval: 15s

scrape_configs:
  - job_name: 'node'
    static_configs:
      - targets:
          - '192.168.1.101:9100'
          - '192.168.1.102:9100'
        labels:
          env: 'production'
Sizing and retention notes
- Default Prometheus local retention is 15 days — increase with
--storage.tsdb.retention.time=90dif you need longer history, and budget disk space accordingly (roughly 1-2 bytes per sample per series) - For dozens of hosts, a single Prometheus instance on modest hardware (2 vCPU, 4 GB RAM) is plenty; only look at remote-write/Thanos/Mimir once you’re monitoring hundreds of nodes
Related tutorials
- Linux Server Health Check Shell Script
- HAProxy Load Balancer Setup
- Docker Container Health Check Script
Terminal screenshots are original illustrations created for Gnome IT Solutions (blog.gnomeitsolutions.com).