
“The server is slow” is the least useful bug report in sysadmin work — slow could mean CPU-bound, memory-starved, disk I/O saturated, or network-limited, and each has a completely different fix. top, vmstat, and iostat together let you narrow that down in about two minutes, before reaching for anything heavier.
This guide explains what each tool’s key columns actually mean, then walks through recognizing a CPU-bound, I/O-bound, and memory-pressure scenario — and finishes with a combined real-world diagnosis.
Step 1: The Troubleshooting Mental Model
Before running any tool, frame the question as one of four categories: is the bottleneck CPU (processes waiting for a core), memory (swapping, page cache thrashing), disk I/O (processes blocked waiting on storage), or network? top, vmstat, and iostat cover the first three directly — network issues usually need a separate tool like iftop or ss.

Step 2: Reading top — Load Average and CPU
The load average (three numbers: 1, 5, 15-minute averages) counts processes wanting CPU time, including ones waiting on disk I/O. A load of 4.82 on a 4-core box means real contention; the same number on a 32-core box is nothing. In the per-process list, watch %CPU for anything pegged near 100%, and the %Cpu(us) summary line — high us (user time) points to application code; high wa (I/O wait) points toward disk, not CPU, being the real bottleneck.
Step 3: Reading vmstat — the Quick Overview
vmstat 1 3 samples every second, three times. Key columns: r (processes runnable, waiting for CPU — sustained high values confirm CPU contention), b (processes blocked, usually on I/O), si/so (swap in/out — any non-zero sustained value here is a red flag), and wa in the CPU section (percentage of time CPU sat idle waiting on I/O to complete).
Step 4: Reading iostat — Disk Detail
Once vmstat‘s wa or b points toward disk, drill in with iostat -x 1 3. %util near 100% means the device is saturated — it’s busy essentially all the time. await is the average time (ms) a request waits, including queue time — a healthy SSD is usually single digits; anything climbing into the tens or hundreds of milliseconds under load means requests are backing up faster than the disk can serve them.
Step 5: Identifying a CPU-Bound Problem
Signature: high load average roughly matching or exceeding core count, high r in vmstat, high %CPU on a specific process in top, and low wa. Fix path: identify the offending process (sort top by CPU with Shift+P), check if it’s expected load (traffic spike) or a runaway process (infinite loop, stuck cron job), and either scale horizontally, optimize the code path, or kill the stuck process.
Step 6: Identifying an I/O-Bound Problem
Signature: high wa in top/vmstat, high b (blocked processes) in vmstat, and confirmed with iostat showing %util near 100% and climbing await. Fix path: identify which process is generating the I/O with iotop (a separate tool worth installing alongside these three), check if it’s a runaway backup job, unindexed database query causing full table scans, or genuinely undersized storage for the workload.
Step 7: Identifying a Memory Pressure Problem
Signature: non-zero and growing si/so (swap activity) in vmstat, low free memory in top with high used, and — critically — this often masquerades as an I/O problem, because swapping IS disk I/O. Check free -h alongside vmstat: if swap usage is climbing while physical RAM is nearly full, the real fix is more RAM, reducing memory-hungry processes, or (as a stopgap) lowering vm.swappiness as covered in our sysctl tuning guide.
Step 8: A Real Diagnosis Walkthrough
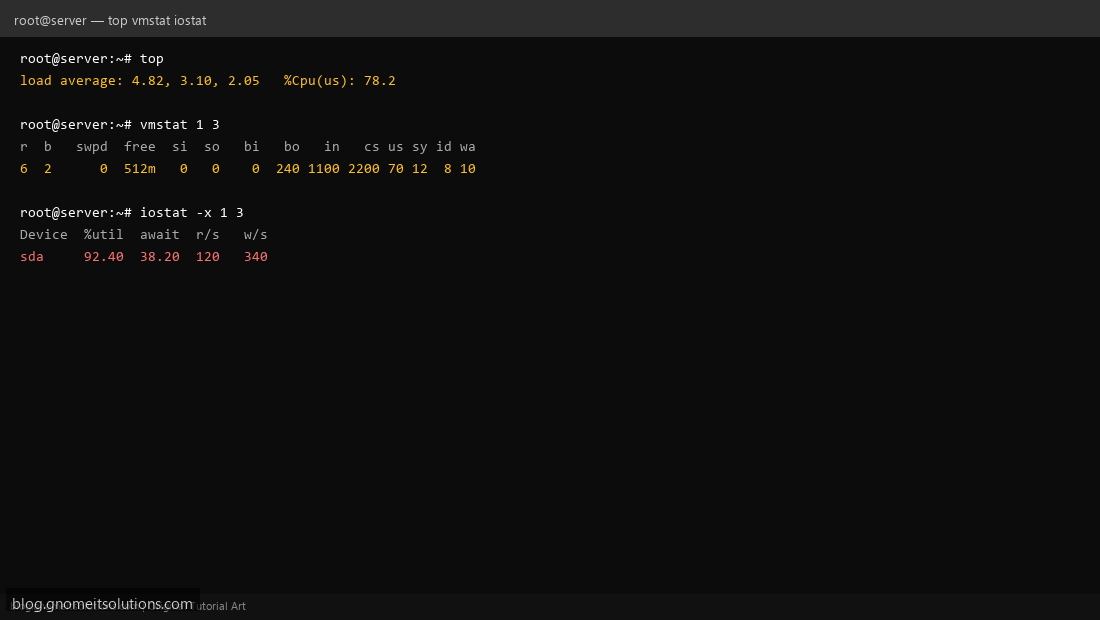
Scenario: users report the app is slow. top shows load average 4.82 on a 4-core box and %Cpu(us) 78% — looks CPU-bound at first glance. But vmstat 1 5 shows wa consistently around 10% and b occasionally non-zero — worth a second look. iostat -x 1 3 confirms sda at 92% util with 38ms await — the disk is actually the real constraint, and the high CPU user-time is the application spinning while waiting on slow queries. The fix here is disk/database-side (add an index, move to faster storage), not adding more CPU cores — which is exactly the kind of wrong fix you’d have shipped by trusting top‘s load average alone.
Command reference
# Overview: load average and per-process CPU/MEM
top

# Sampled system-wide view (CPU, memory, swap, I/O)
vmstat 1 5

# Per-device disk detail
iostat -x 1 3

# Per-process disk I/O (separate package: sysstat/iotop)
iotop -o

# Memory summary
free -h
Quick reference: what points where
- High %CPU, low wa, low swap → CPU-bound, look at the specific process
- High wa, high iostat %util/await, low swap → disk I/O-bound
- Non-zero si/so, low free memory → memory pressure, often masquerading as I/O
Related tutorials
- sysctl and Kernel Tuning Basics
- Linux Server Health Check Shell Script
- Linux Swap and Memory Alert Shell Script
Terminal screenshots are original illustrations created for Gnome IT Solutions (blog.gnomeitsolutions.com).