Our Prometheus + Grafana guide used
node_exporter to monitor guest operating systems — CPU, memory, disk from inside each
VM. That tells you nothing about the hypervisor layer itself: is a Proxmox node up, is a
storage target running low on space, did a VM you expect to be running actually stop unexpectedly?
pve-exporter answers those questions by querying the Proxmox API directly and exposing the
results in Prometheus format.
This guide installs pve-exporter, connects it to Proxmox with a scoped API token, wires it into your
existing Prometheus + Grafana stack, and sets an alert on a real hypervisor-level condition.
Step 1: Understand What pve-exporter Adds
node_exporter answers “is this guest OS healthy?”; pve-exporter answers “is the hypervisor itself healthy, and what does it report about its VMs and storage from the outside?” — node up/down, storage pool usage percentages, and per-VM status (running/stopped) as seen by Proxmox, independent of whether the guest OS is even capable of running its own exporter. Both together give you full-stack visibility.
Step 2: Install pve-exporter
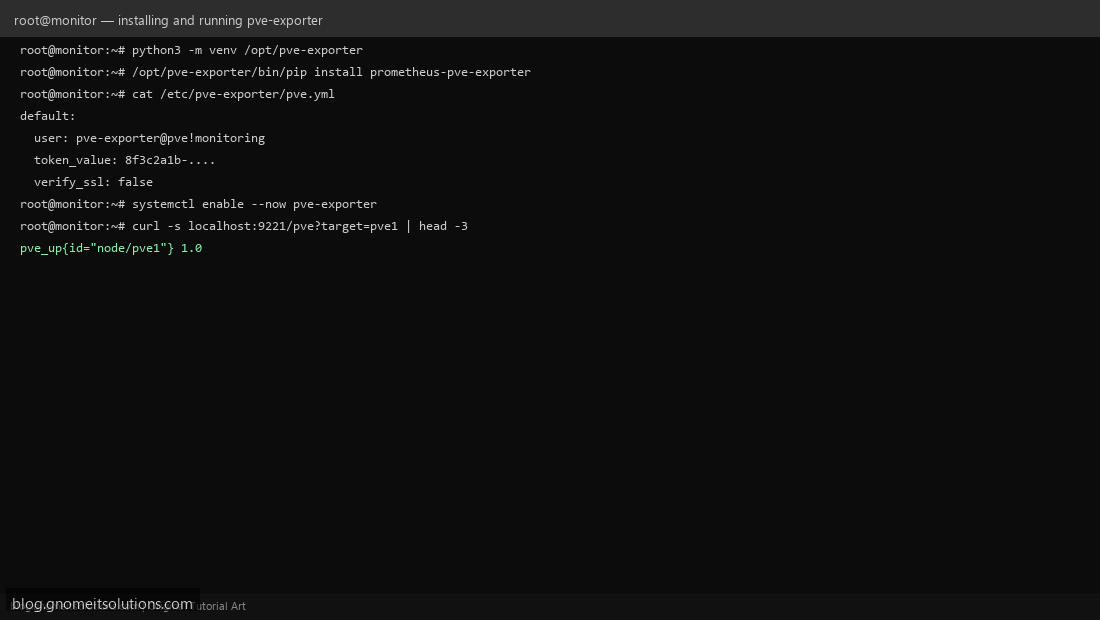
pve-exporter is a Python tool, best installed in its own virtual environment to avoid conflicting with system packages: python3 -m venv /opt/pve-exporter, then /opt/pve-exporter/bin/pip install prometheus-pve-exporter. Install it on your monitoring server (the same box running Prometheus is fine) — it doesn’t need to run on the Proxmox node itself, since it talks to Proxmox over the API.
Step 3: Create a Scoped API Token
Following the same pattern from our API tokens guide: create a dedicated user (pveum user add pve-exporter@pve), grant it read-only access (PVEAuditor role is sufficient — the exporter only reads status, it never changes anything), and create an API token for it. Never use a full-admin token for a monitoring agent.
Step 4: Configure pve.yml
Create /etc/pve-exporter/pve.yml with a default: section containing user: pve-exporter@pve!monitoring, token_value: YOUR_TOKEN, and verify_ssl: false (or point it at your real CA if Proxmox uses a properly signed certificate). This file tells the exporter which Proxmox credentials to authenticate with when it’s queried.
Step 5: Run pve-exporter as a systemd Service
Wrap the venv’s pve_exporter command in a systemd unit pointing at your pve.yml config, then systemctl enable --now pve-exporter. Confirm it’s serving metrics: curl -s localhost:9221/pve?target=pve1 should return Prometheus-format text output including a pve_up metric.
Step 6: Add the Scrape Config to Prometheus
pve-exporter works differently from node_exporter — it’s a single process that proxies queries for any node via a target query parameter, rather than one exporter per host. In prometheus.yml, add a job using params: { target: [pve1, pve2, pve3] } style multi-target config (or one job block per node for simplicity) pointing at your exporter’s :9221 endpoint.
Step 7: Build a Grafana Dashboard for Proxmox Metrics
Using the same Grafana instance from our Prometheus + Grafana guide, either import a community Proxmox dashboard (search grafana.com for “Proxmox via Prometheus”) or build panels directly from key metrics: pve_up (node reachability), pve_disk_usage_bytes / pve_disk_size_bytes (storage capacity), and pve_guest_info (VM status).
Step 8: Alert on Hypervisor-Level Conditions
Set alert rules on conditions node_exporter could never catch: pve_up == 0 (a node stopped responding to the API entirely — potentially worse than a single VM being down), storage usage crossing 85-90% (pve_disk_usage_bytes / pve_disk_size_bytes), or a VM’s pve_guest_info status showing stopped when your records say it should be running — catching a crashed VM even if nobody happened to be watching the console.
Command reference
# Install in a virtual environment
python3 -m venv /opt/pve-exporter
/opt/pve-exporter/bin/pip install prometheus-pve-exporter

# pve.yml
cat <<EOF > /etc/pve-exporter/pve.yml
default:
  user: pve-exporter@pve!monitoring
  token_value: YOUR_TOKEN_SECRET
  verify_ssl: false
EOF

# Test locally
curl -s localhost:9221/pve?target=pve1
Related tutorials
- Prometheus + Grafana Monitoring Stack
- Proxmox API Tokens and Automation
- Centralized Logging with Loki + Promtail
Image credits: All illustrations use original Proxmox VE branded artwork created
for Gnome IT Solutions — not copied from vendor marketing assets or third-party screenshots.
Tutorial text © Gnome IT Solutions.
Image credits: Screenshots are from the official
Proxmox VE documentation
(Proxmox GmbH), used under open documentation terms for educational purposes.
Tutorial text and layout © Gnome IT Solutions.