
A ViciDial database does two jobs at once: constant small writes from live agents and the hopper, and periodic heavy reads from
reports. When the database slows down, everything slows down — agent screens lag, calls wait for leads, and reports time out. The fix
is rarely one magic setting; it is measuring, sizing memory correctly, and keeping the big log tables from growing forever.
This guide complements our backup automation and
crashed table repair posts, and assumes the dedicated DB server from the
cluster architecture guide.
Where the Database Time Goes
Three workloads dominate: frequent updates to live-agent and hopper tables, ever-growing log tables such as vicidial_log, and reporting queries that scan them.
  live agents + hopper --> many small writes
  vicidial_log growth   --> big tables
  reports               --> heavy reads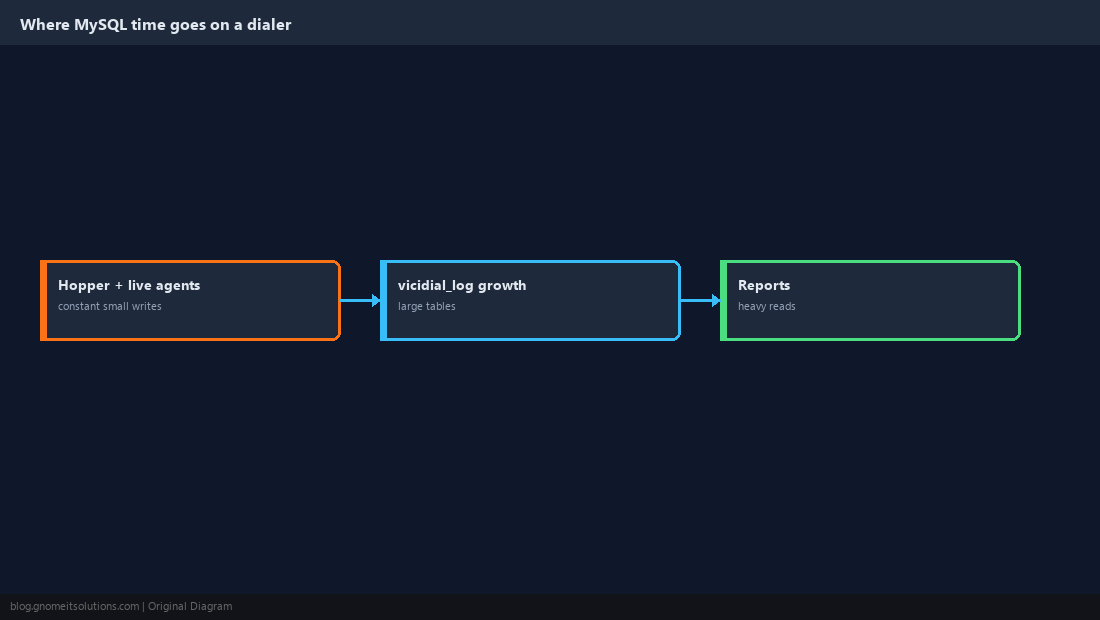
Measure Before You Change Anything
Record baseline numbers at peak hours so you can prove a change helped. Never tune from a blog post’s numbers alone.
SHOW GLOBAL STATUS LIKE 'Threads_running';
SHOW GLOBAL STATUS LIKE 'Innodb_buffer_pool_reads';
SHOW GLOBAL STATUS LIKE 'Innodb_buffer_pool_read_requests';
SHOW GLOBAL STATUS LIKE 'Slow_queries';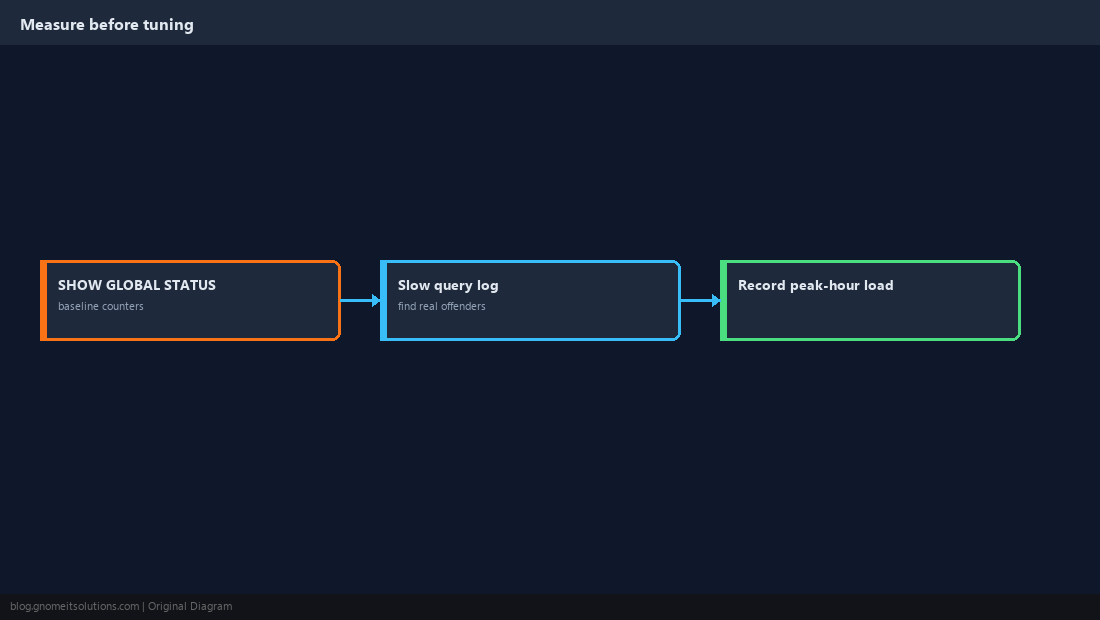
Size the InnoDB Buffer Pool
The buffer pool caches table and index data. On a dedicated database server, 50–70% of RAM is a common starting point; on a shared box use less. The read-miss ratio (reads divided by read_requests) should stay tiny.
[mysqld]
innodb_buffer_pool_size = 12G      # example for a 24G dedicated DB host
innodb_log_file_size = 1G
innodb_flush_log_at_trx_commit = 1innodb_flush_log_at_trx_commit trades crash safety for speed. Keep 1 unless you accept losing the last second of writes.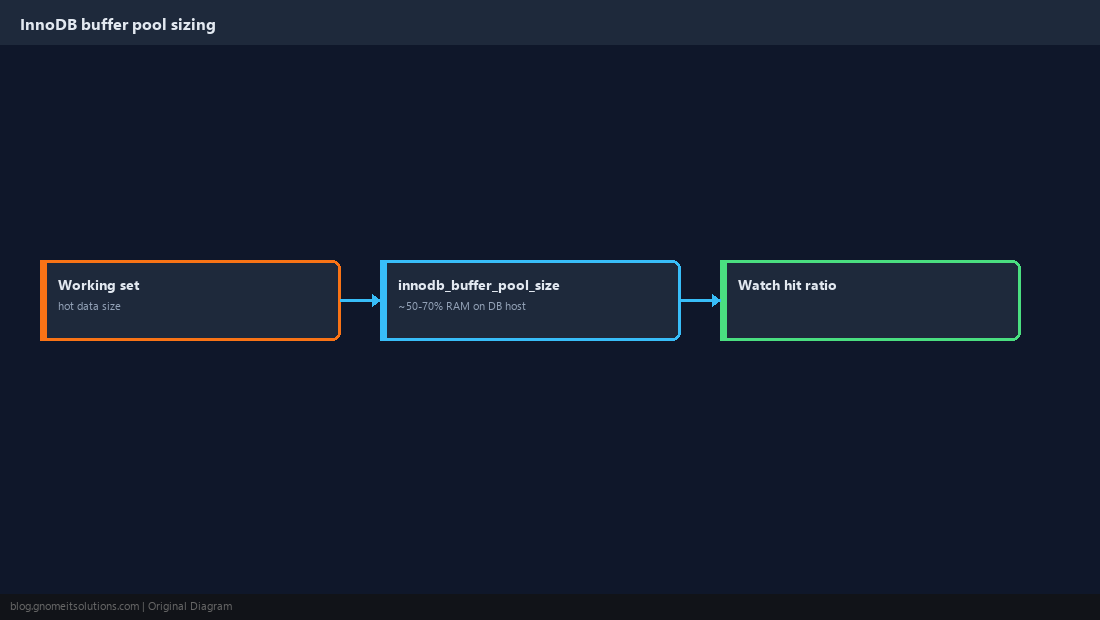
Set Connection Limits Sensibly
Every agent, cron script and report holds connections. Too low and agents get errors; too high and memory is wasted. Reap idle connections.
max_connections = 600
wait_timeout = 600
interactive_timeout = 600
thread_cache_size = 64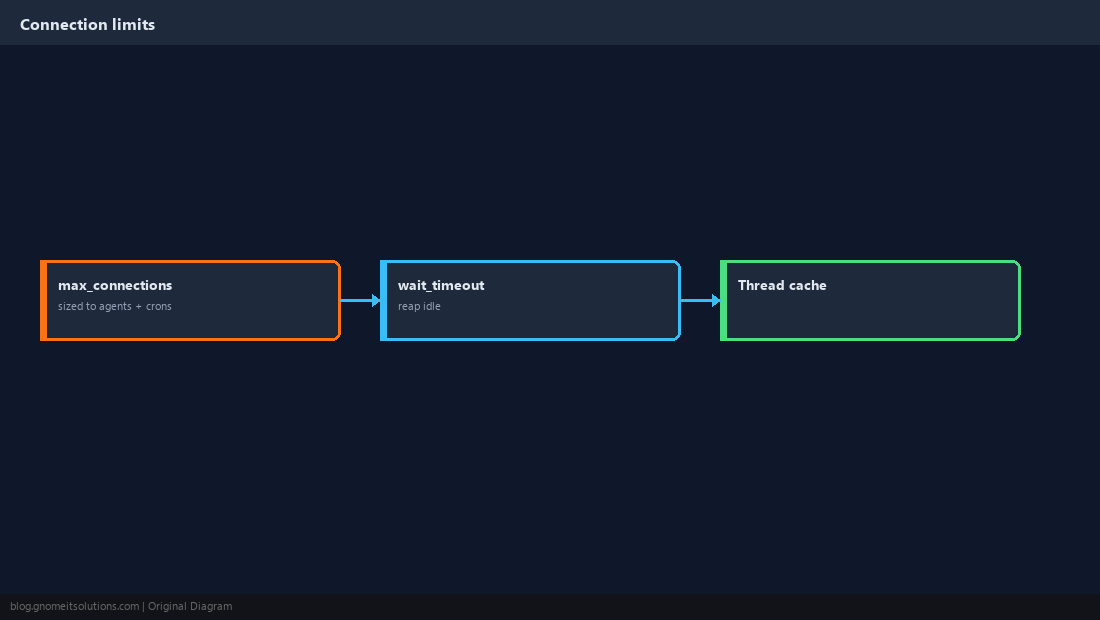
Use the Slow Query Log
Log queries slower than a threshold, summarise them, and fix the worst offenders first, usually with an index or a narrower report date range.
slow_query_log = 1
slow_query_log_file = /var/log/mysql/slow.log
long_query_time = 1mysqldumpslow -s t -t 10 /var/log/mysql/slow.logEXPLAIN SELECT * FROM vicidial_log WHERE call_date > '2026-01-01' AND campaign_id = 'SALES01';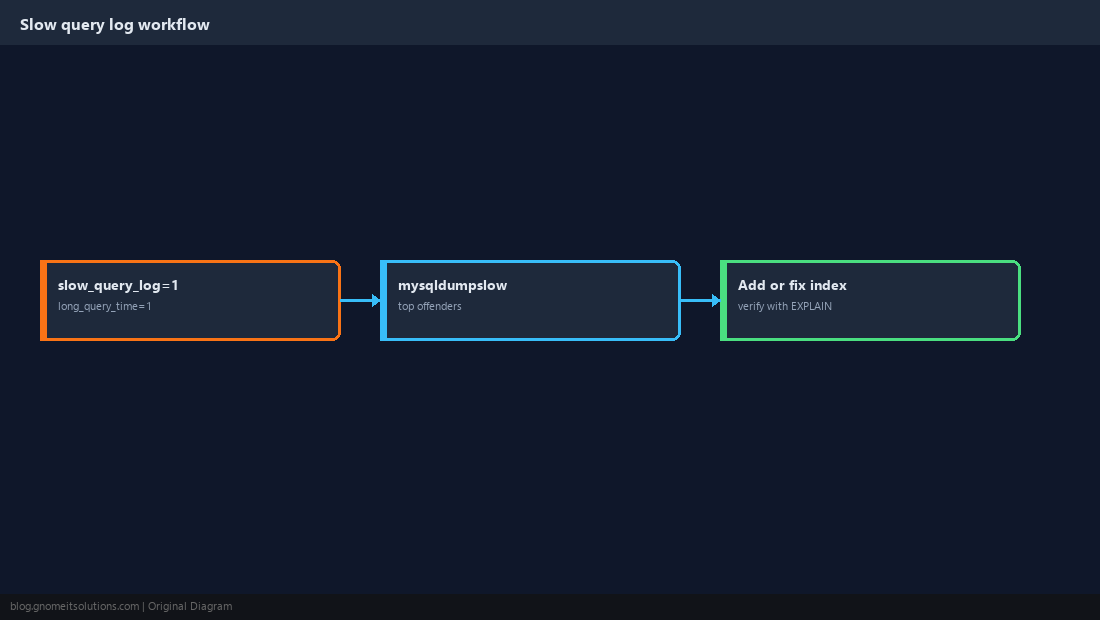
Archive Old Log Rows
Reports over years of call history are slow because the tables are huge. Move old rows to archive tables on a schedule so daily queries touch recent data only. Take a verified backup first.
# Runs nightly; check your install's docs for exact flags
/usr/share/astguiclient/AST_DB_optimize.pl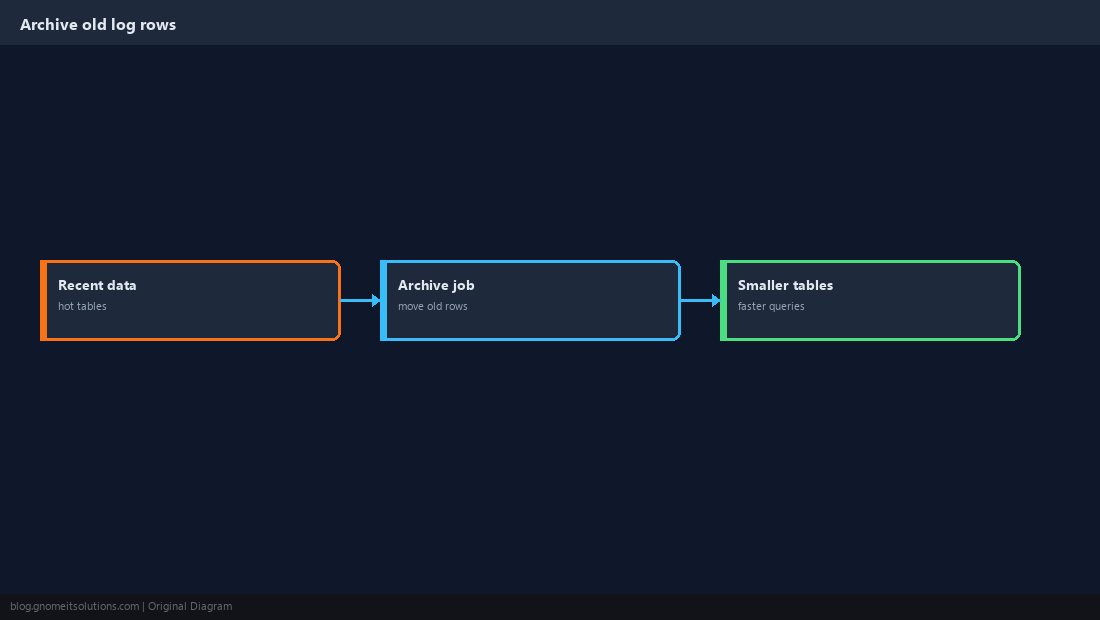
Put Storage and tmpdir in the Right Place
Data files belong on fast SSD/NVMe, separate from bulky call recordings. Sorts that spill to disk are slow, so give MySQL a RAM-backed tmpdir if memory allows.
tmpdir = /dev/shm/mysqltmp
tmp_table_size = 256M
max_heap_table_size = 256M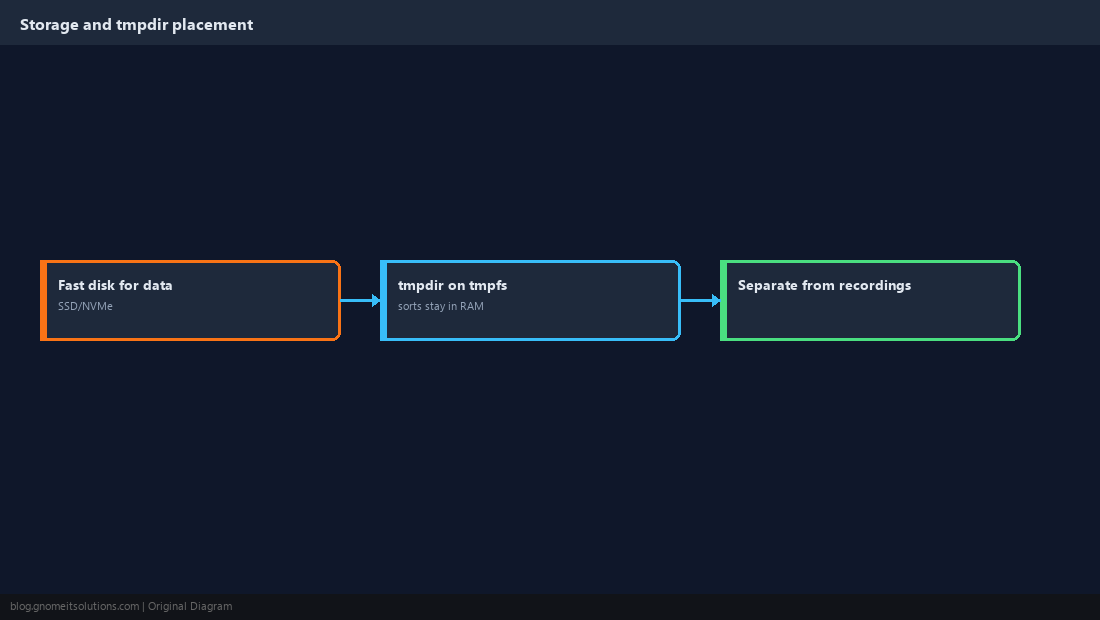
Monitor Continuously
Alert on rising Threads_running, slow-query counts and disk growth so you act before agents notice. Feed these metrics to Prometheus and Grafana.
mysqladmin -u root -p extended-status | grep -E 'Threads_running|Slow_queries|Aborted_connects'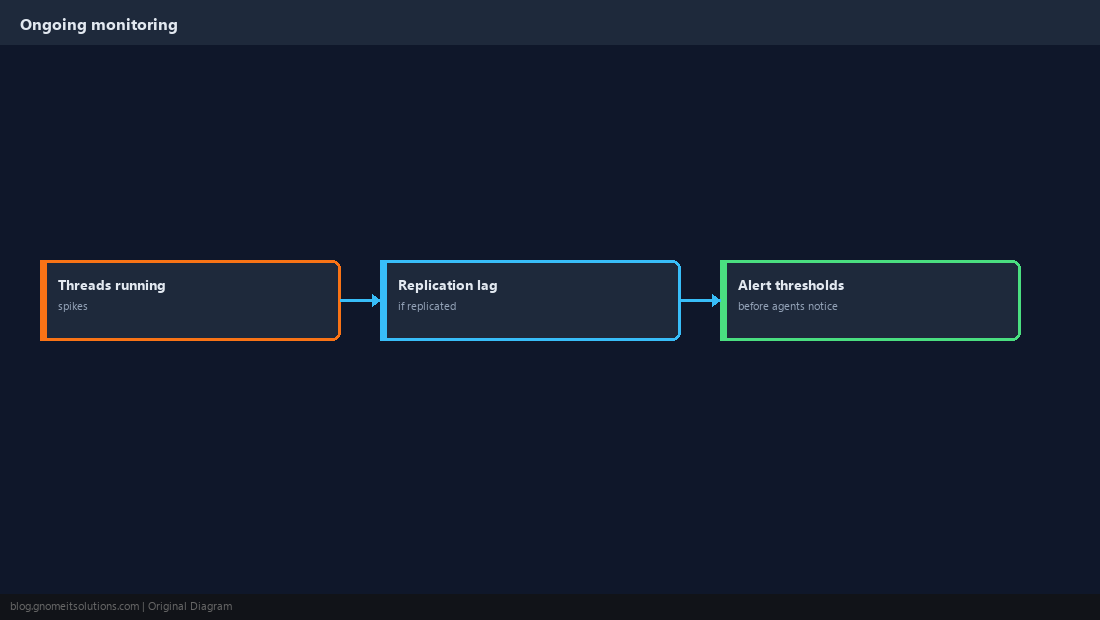
Quick Reference
- Measure first; buffer pool ~50–70% RAM on a dedicated host; sane
max_connections - Slow log weekly; archive old logs; monitor and alert
Related tutorials
Diagrams are original illustrations by Gnome IT Solutions. Tutorial text © Gnome IT Solutions.