When a server feels slow, the first question is whether you are out of CPU, out of RAM, or waiting on disk. The answer is usually visible in
free, top or htop within a few seconds — if you know which column to trust.
This guide is the practical reading order: memory summary, load average, then per-process CPU and RAM. For long-term graphs, pair it with
Prometheus and Grafana or our
disk usage guide when iowait dominates.
Three Tools, One Picture
The kernel exposes counters in /proc. free summarises RAM and swap; top and htop list processes and refresh live.
/proc/meminfo, /proc/stat --> free / top / htop --> you pick the hot PID or the full disk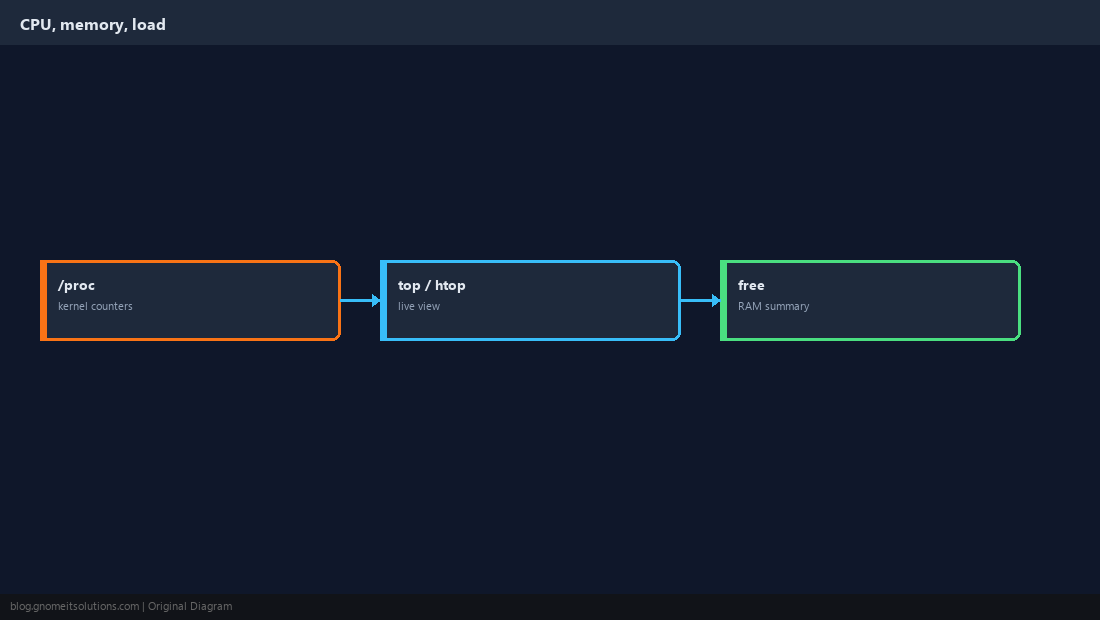
Read free -h Correctly
On modern Linux, available is more useful than free alone because the kernel uses spare RAM for cache that it can reclaim.
free -h
grep -E 'Mem|Swap' /proc/meminfo | head -4available with high swap used is a stronger warning than used alone.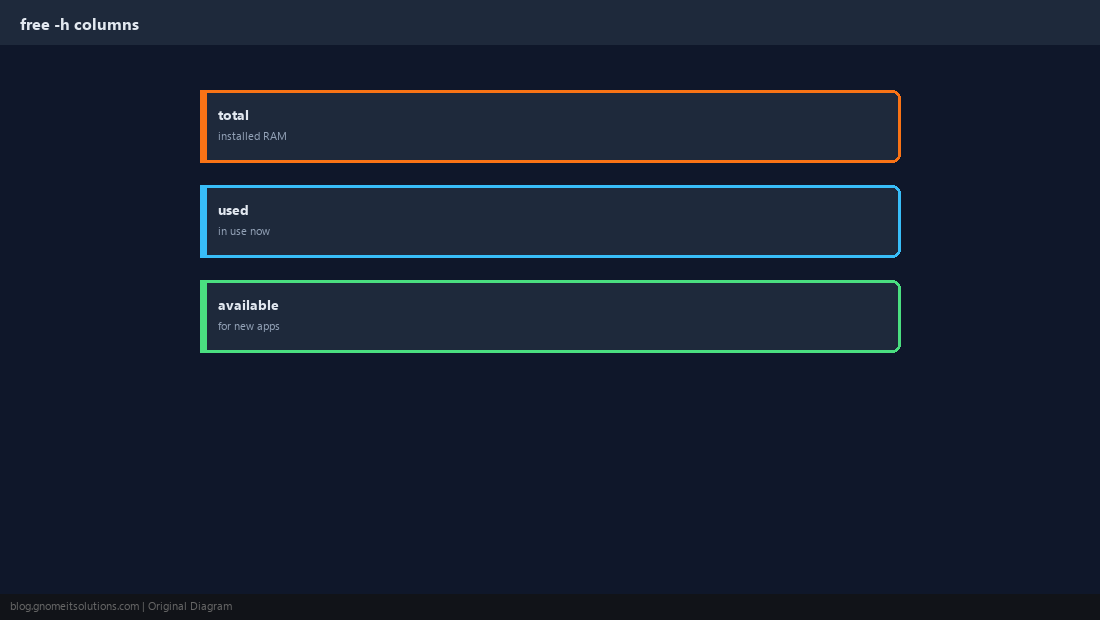
Classic top
top ships everywhere. Watch %CPU, %MEM, and the load line at the top.
top -b -n 1 | head -20top -o %MEM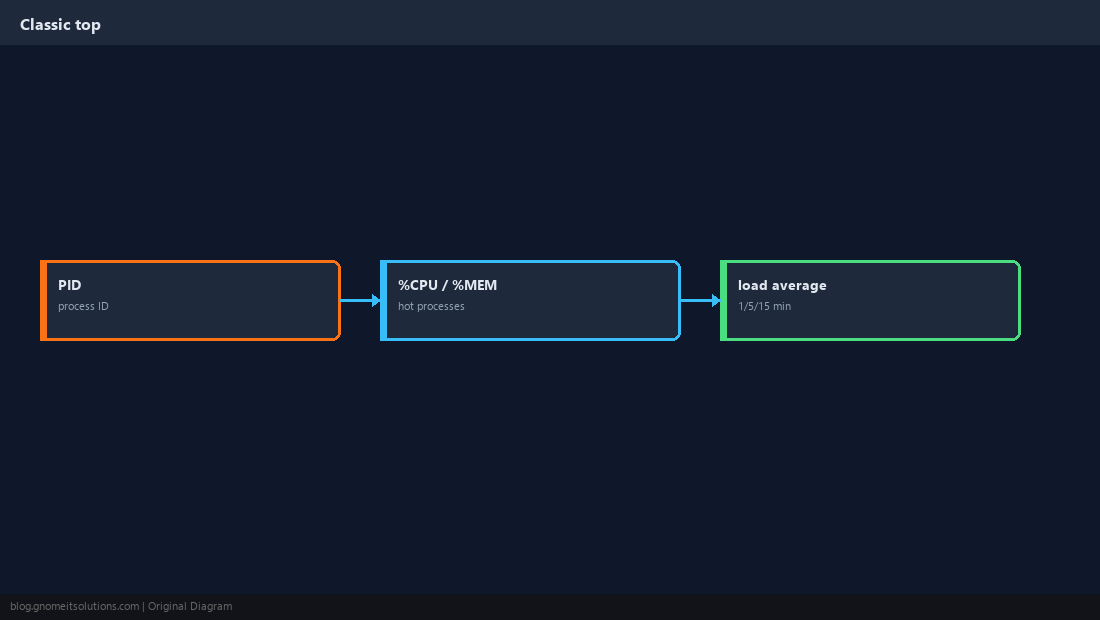
htop: Sort, Tree and Kill
Install htop for colour, mouse support, and function keys. F6 changes sort; F5 shows parent/child trees.
sudo apt install -y htop # or: sudo dnf install -y htophtopF9 sends signals — try SIGTERM before SIGKILL on production services.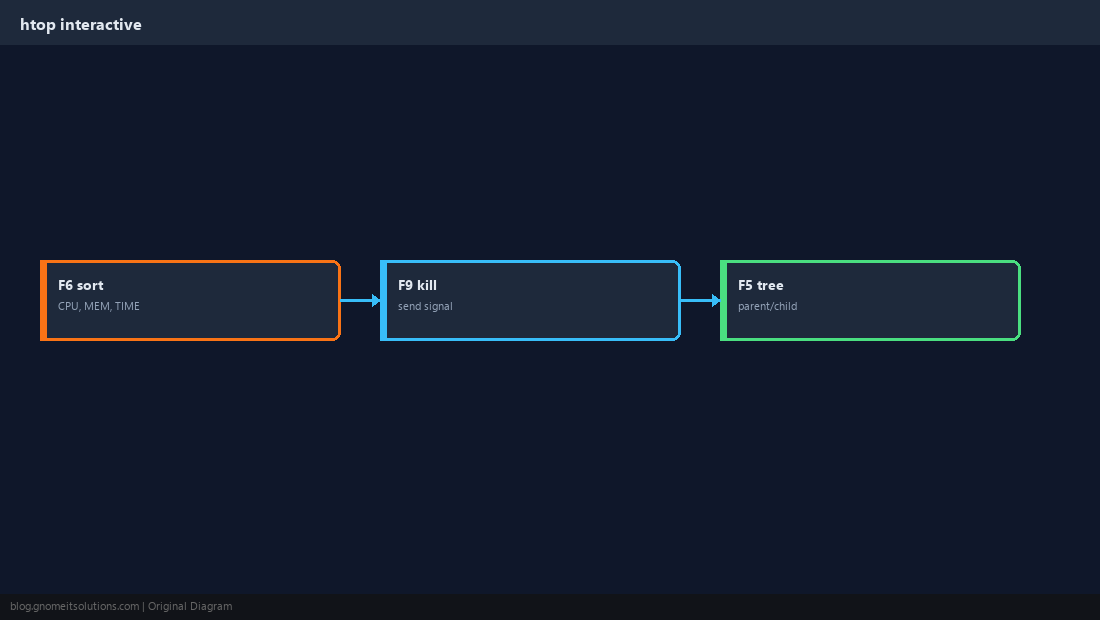
Load Average vs CPU Cores
Load is a running average of runnable tasks. Sustained load above the number of CPU cores means work is queuing.
nproc
uptime
top -b -n 1 | grep -i loadwa in vmstat 1.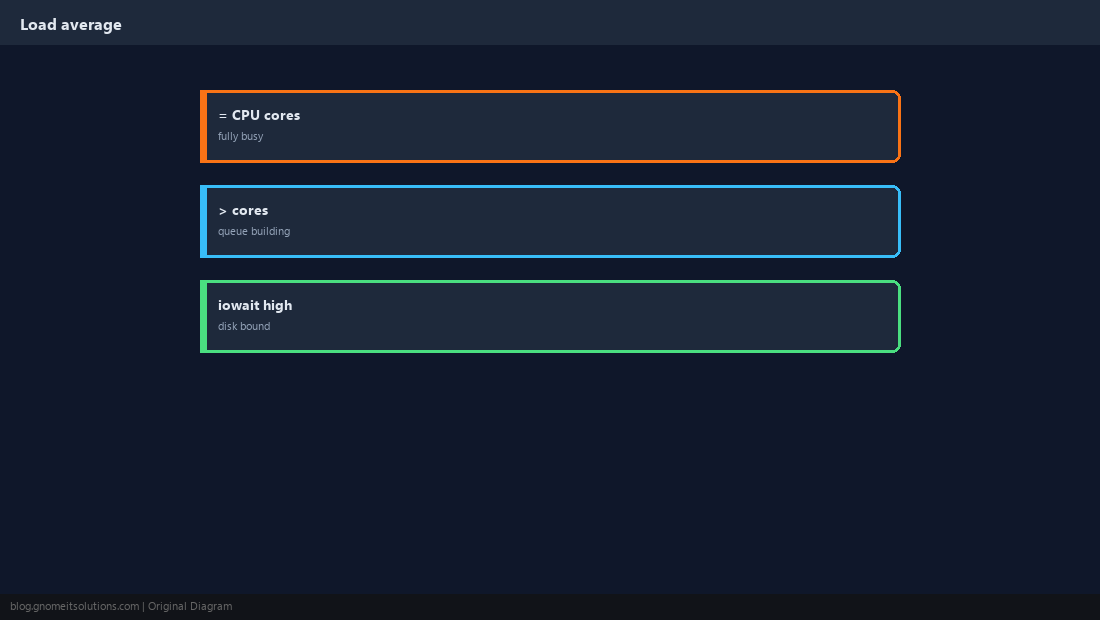
Swap and Memory Pressure
Swap is a safety valve, not extra RAM. Steady swap churn (si/so in vmstat) hurts latency.
swapon --show
vmstat 1 5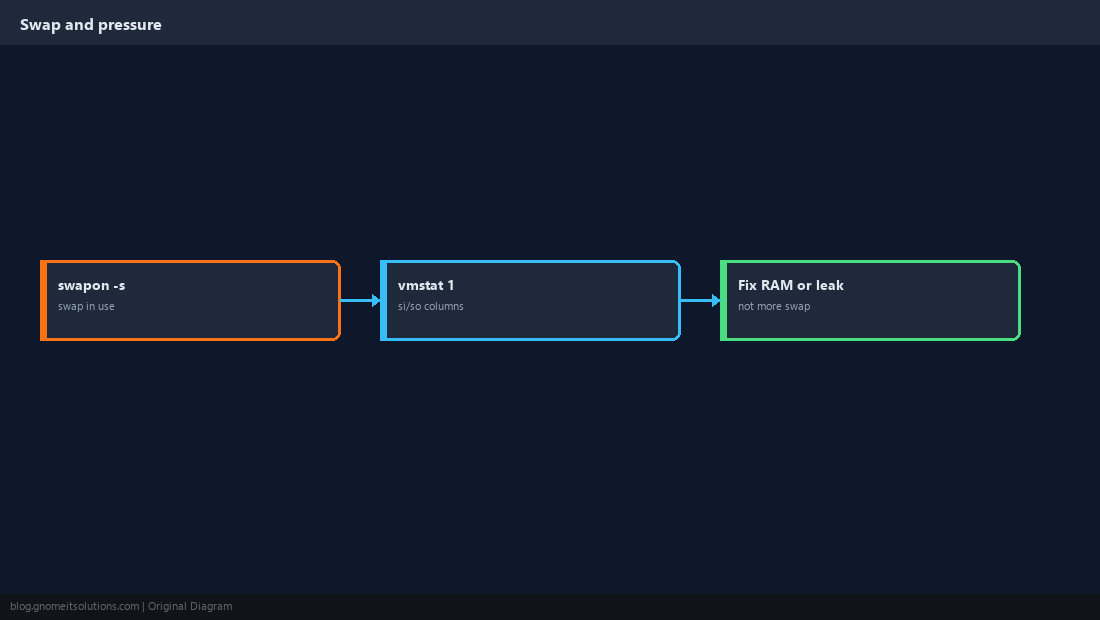
When to Go Deeper
One PID at 100% CPU, sudden OOM kills, or load that never drops after an incident deserve the next layer: logs, strace, or service restarts via systemd.
journalctl -k --since today | grep -i 'out of memory'ps aux --sort=-%cpu | head -10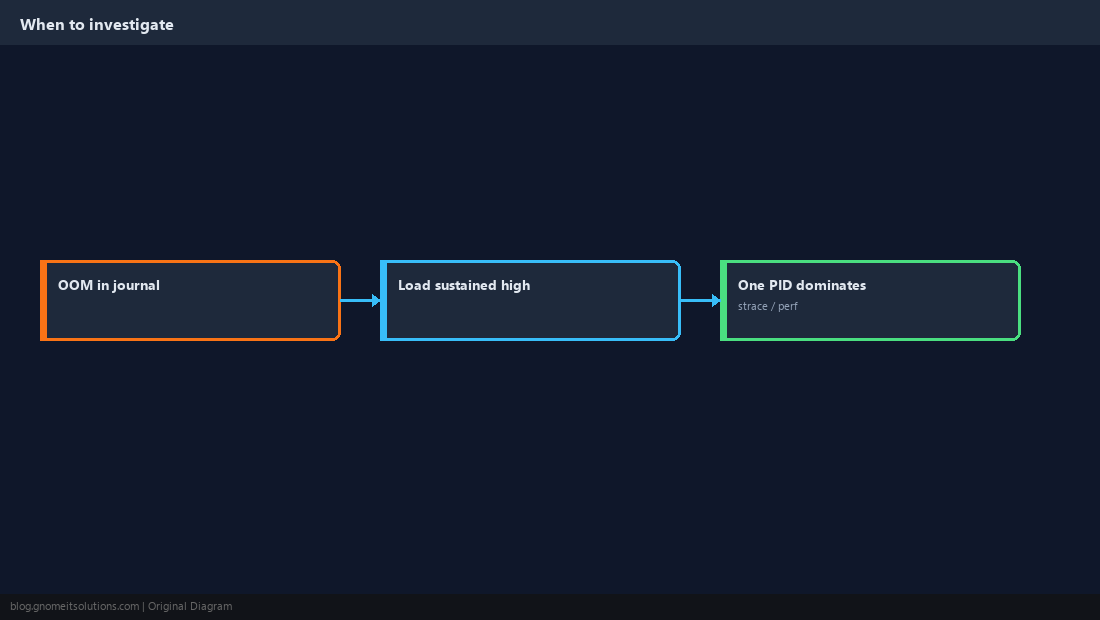
Quick Reference
free -h— trustavailable; watch swap- Load > CPU cores sustained = queuing
htopF6 sort, F9 signal (TERM before KILL)
Related tutorials
Diagrams are original illustrations by Gnome IT Solutions. Tutorial text © Gnome IT Solutions.